---
title: Analyze Data in the Dashboards with AI Insights
description: Analyze Data in the Dashboards with AI Insights Otuvy’s dashboards provide powerful data visualization tools that help you track key metrics, uncover tren…
---
[Skip to content](https://help.otuvy.com/kb/analyze-data-in-the-dashboards-with-ai-insights#main-content)
[More support](https://help.otuvy.com/kb/kb-tickets/new?hsLang=en)

Open main navigation
Close main navigation
- [More support](https://help.otuvy.com/kb/kb-tickets/new)
- [Contact us](mailto:vip@otuvy.com)
[Contact us](mailto:vip@otuvy.com)
How can we help you?
- There are no suggestions because the search field is empty.
1. [Otuvy Knowledge Base](https://help.otuvy.com/kb?hsLang=en)
2. [Otuvy QM - Reports & Dashboards](https://help.otuvy.com/kb/otuvy-qm-reports-dashboards?hsLang=en)
# Analyze Data in the Dashboards with AI Insights
# Analyze Data in the Dashboards with AI Insights
Otuvy’s dashboards provide powerful data visualization tools that help you track key metrics, uncover trends, and make informed decisions. With built-in filtering, drill-down capabilities, and historical data views, you can analyze performance at a glance and gain deeper insights into your operations. Whether you're reviewing service quality, compliance metrics, or operational efficiency, Otuvy’s dashboards equip you with the tools to transform raw data into actionable intelligence.
## Analyze Data
1\. To leverage insights in Otuvy QM Click on **More** on any dashlet you wish to analyze
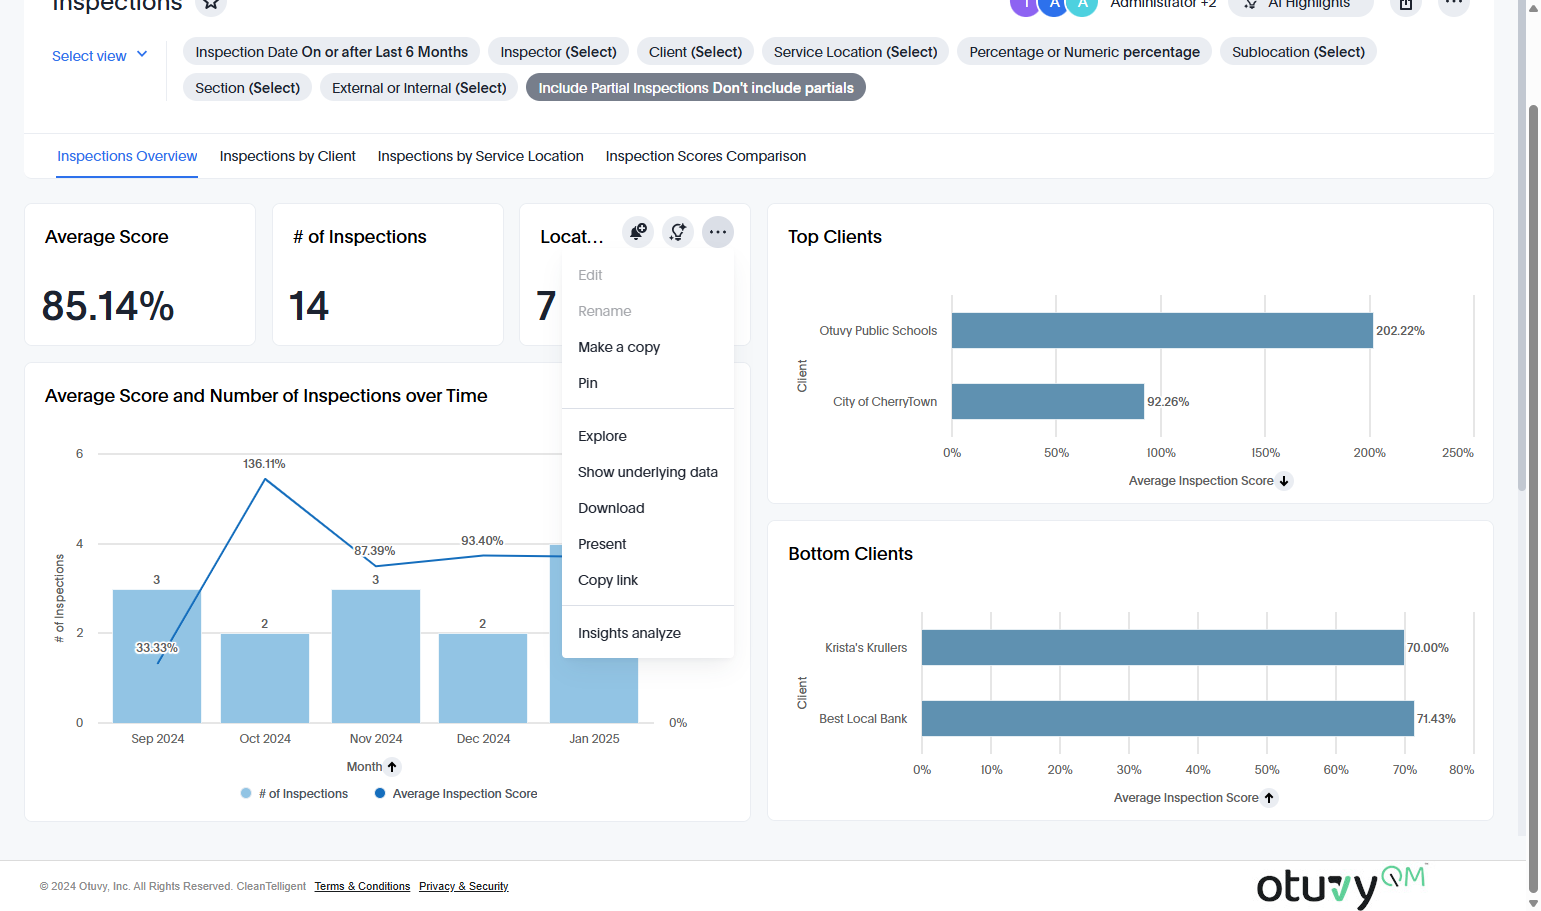
2\. Click on **Insights analyze**
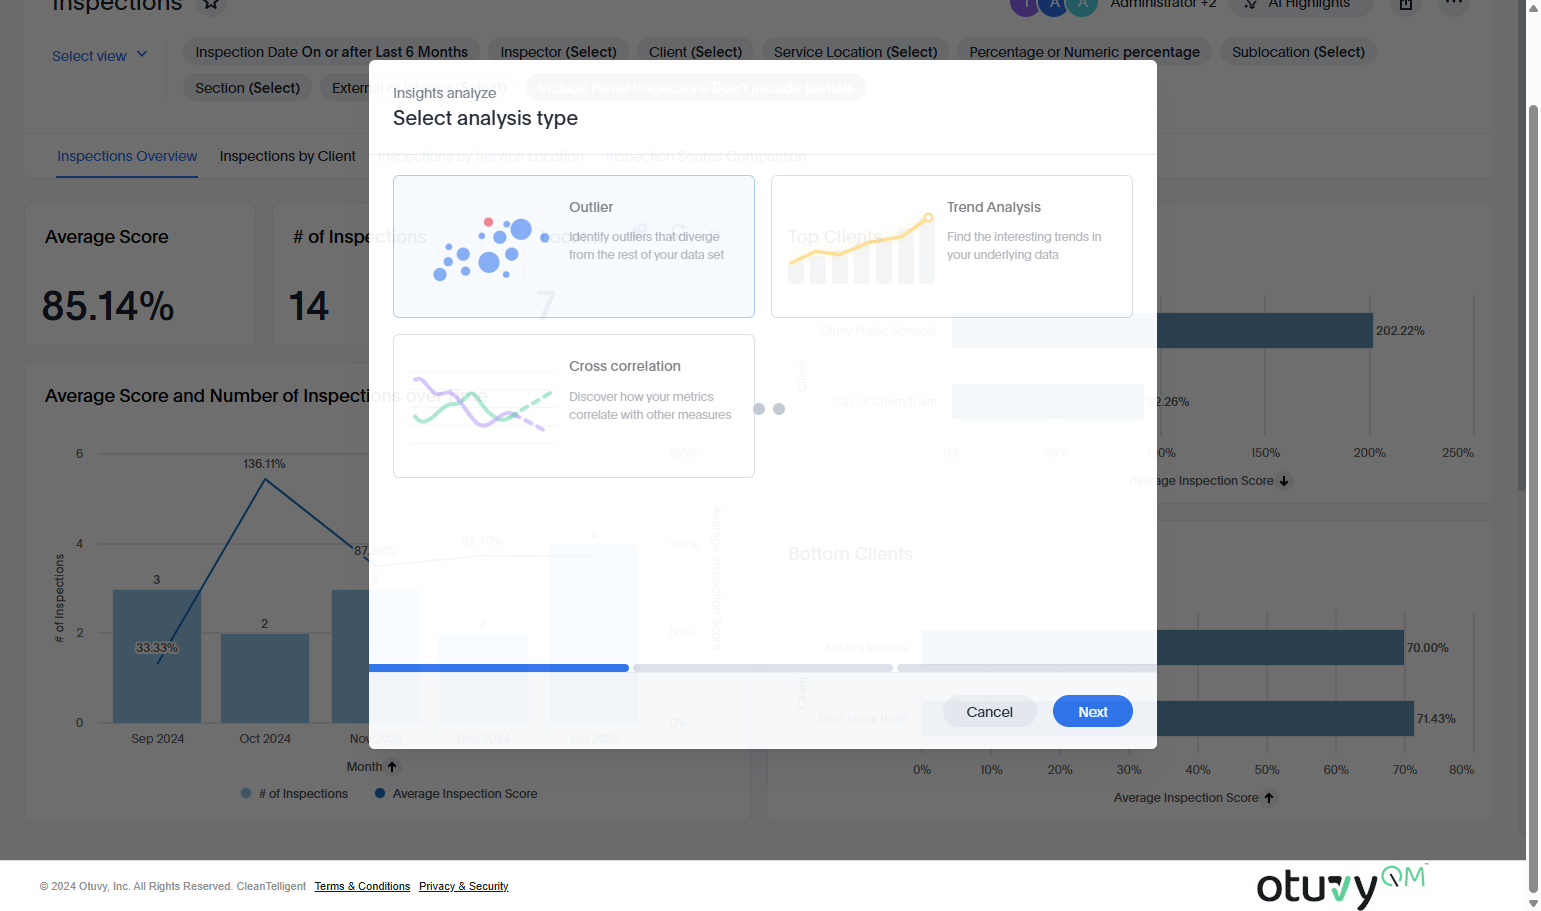
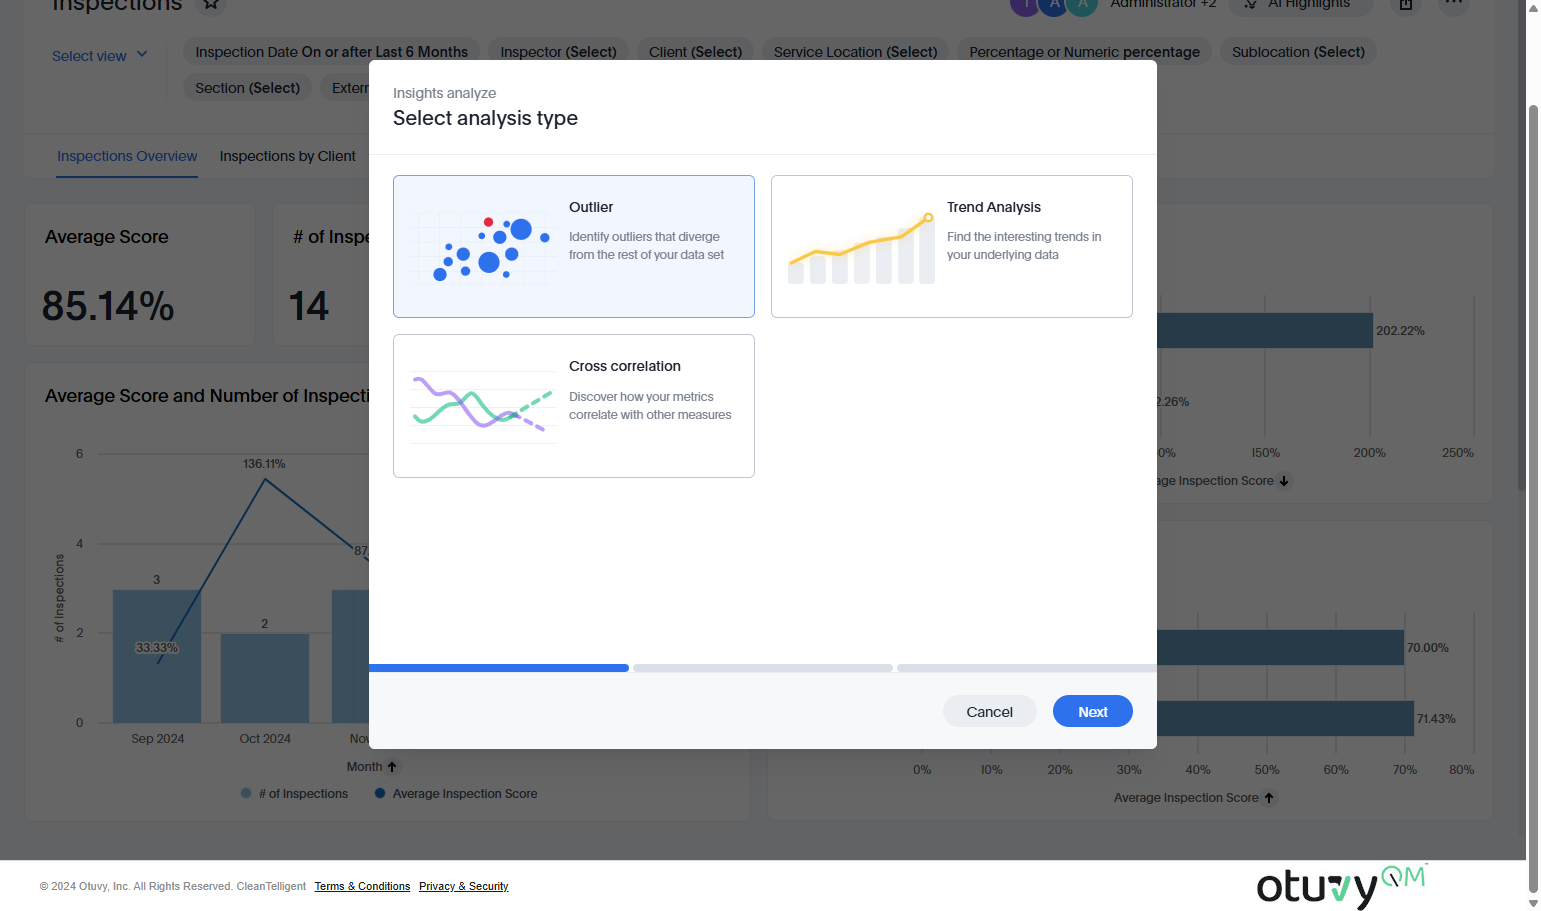
3\. Select the type of analysis you wish to perform
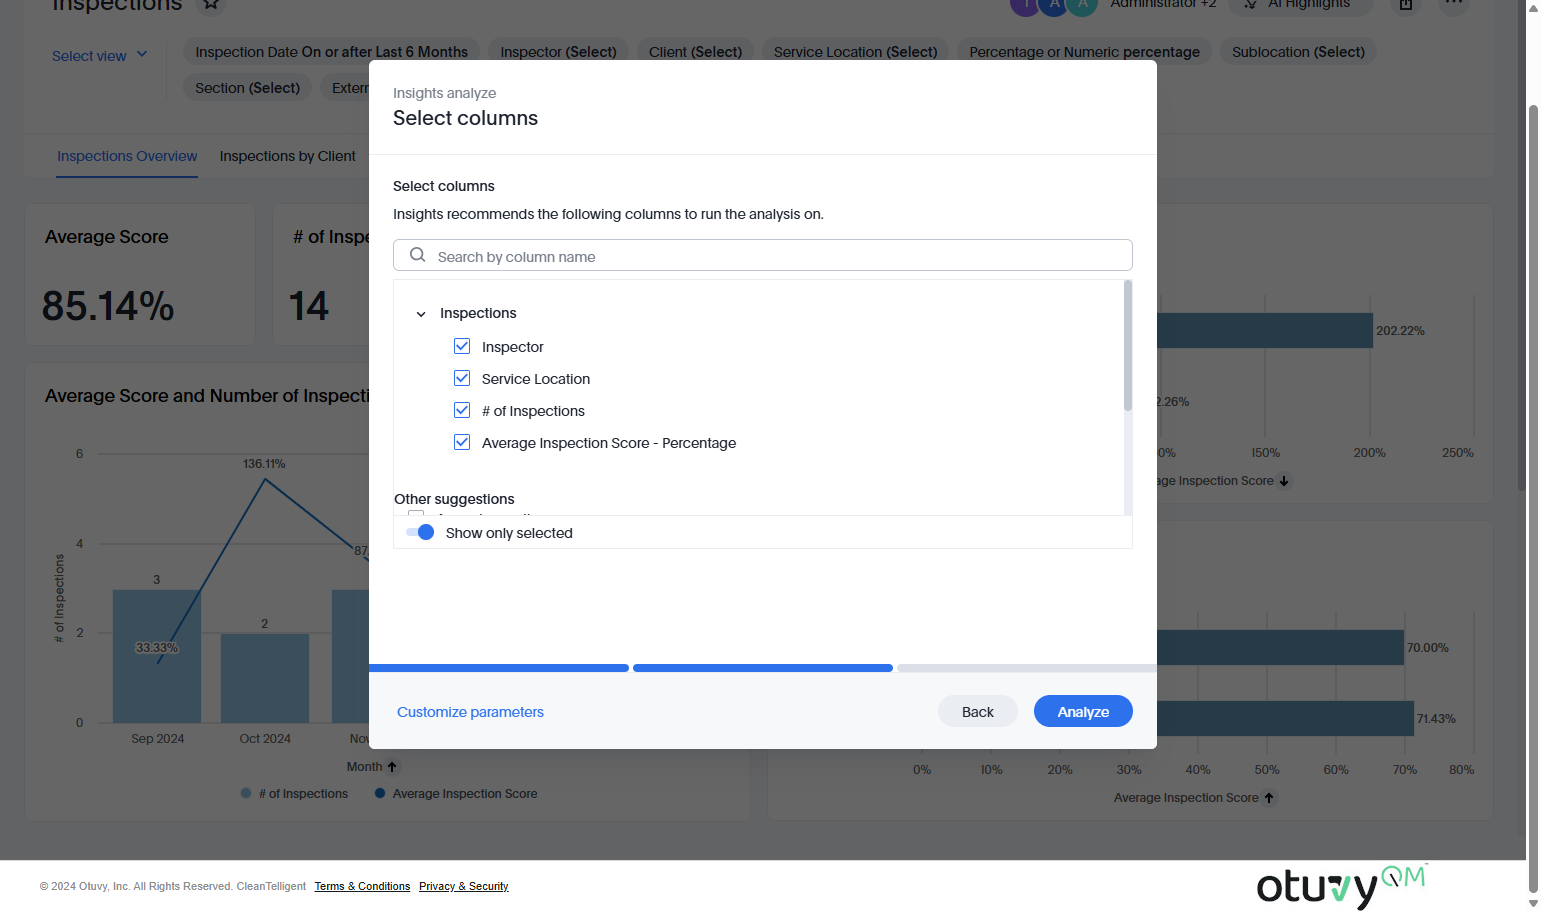
4\. Select the **columns** of data you want to include in the analysis, and click Analyze
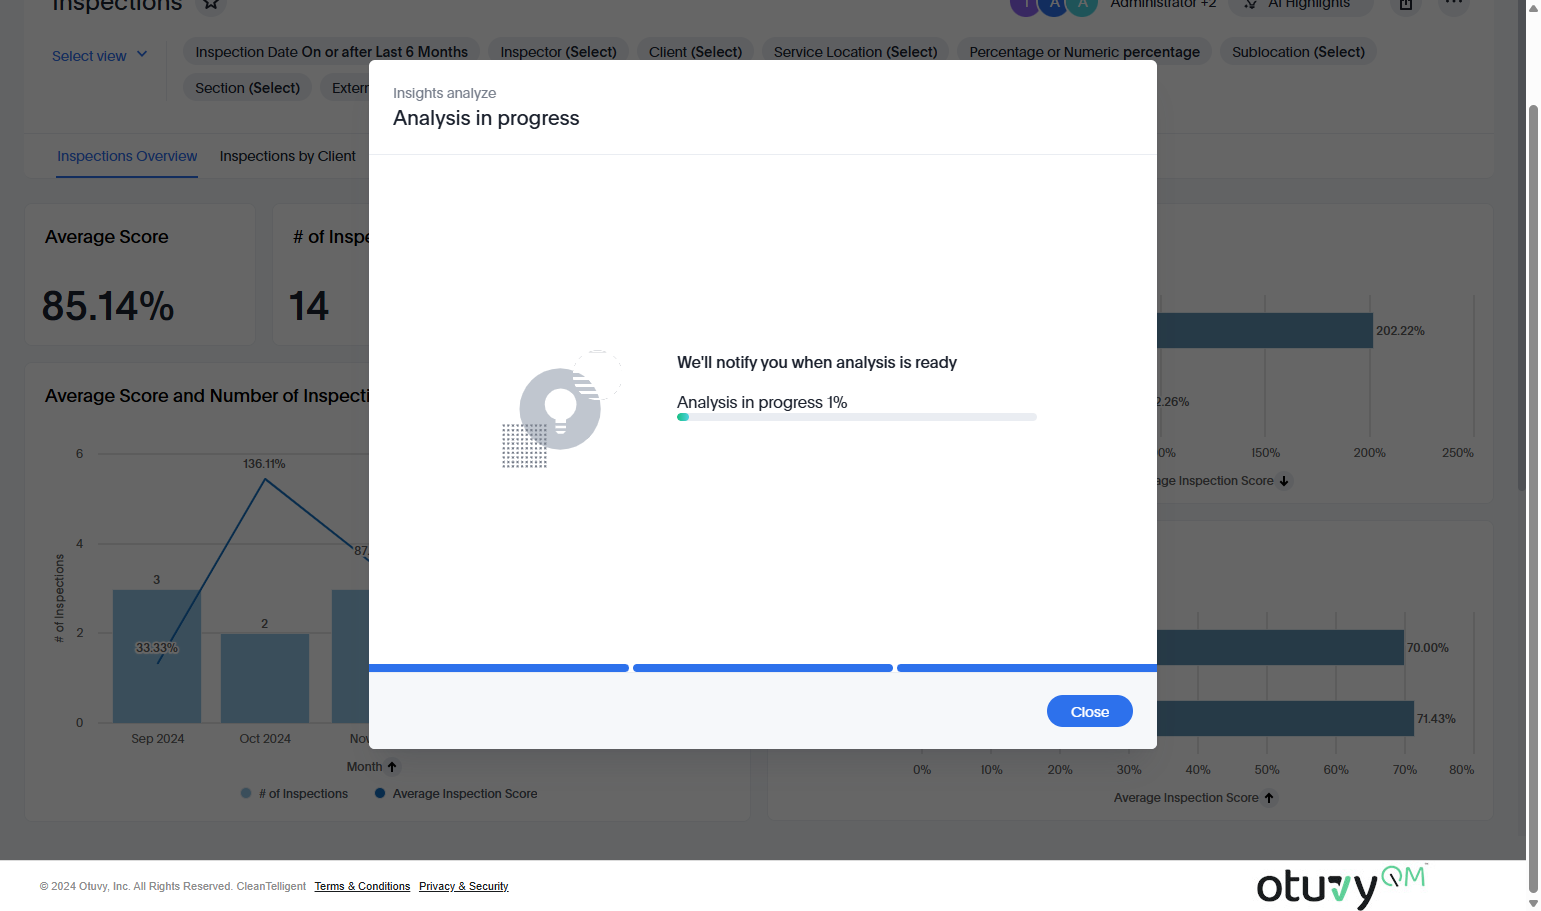
5\. This may take a moment to analyze the data
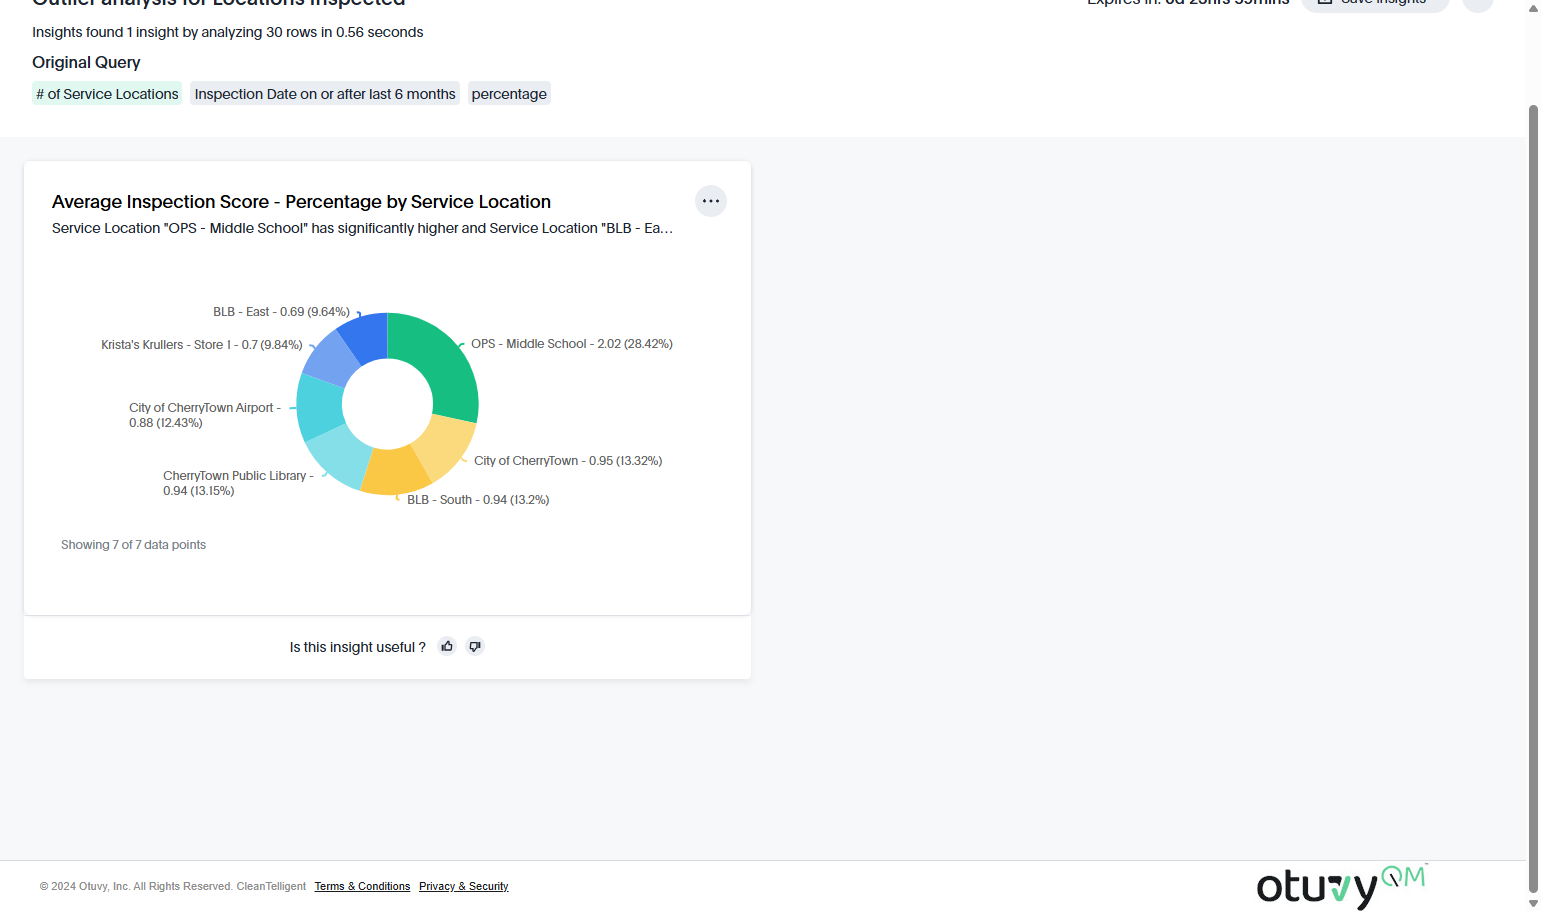
6\. Once the analysis is complete you can review the data provided
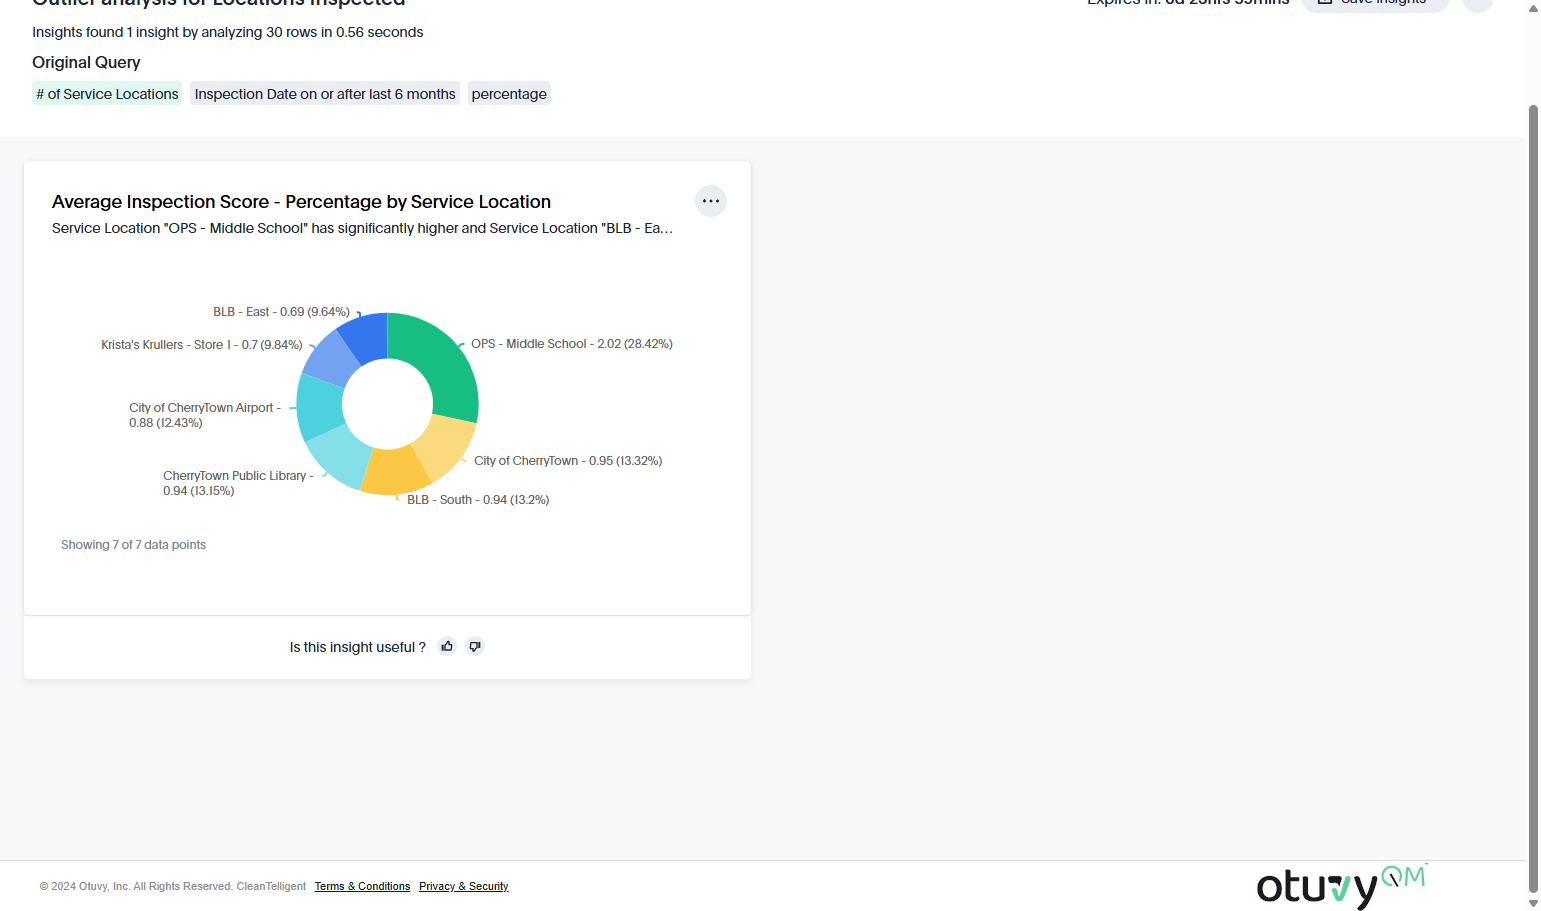
7\. Train the AI by letting it know if the insights were helpful or not
## Schedule Analysis
If you find the analysis useful you can schedule it to be run periodically.
1\. To do this can click on the More icon next to your analysis
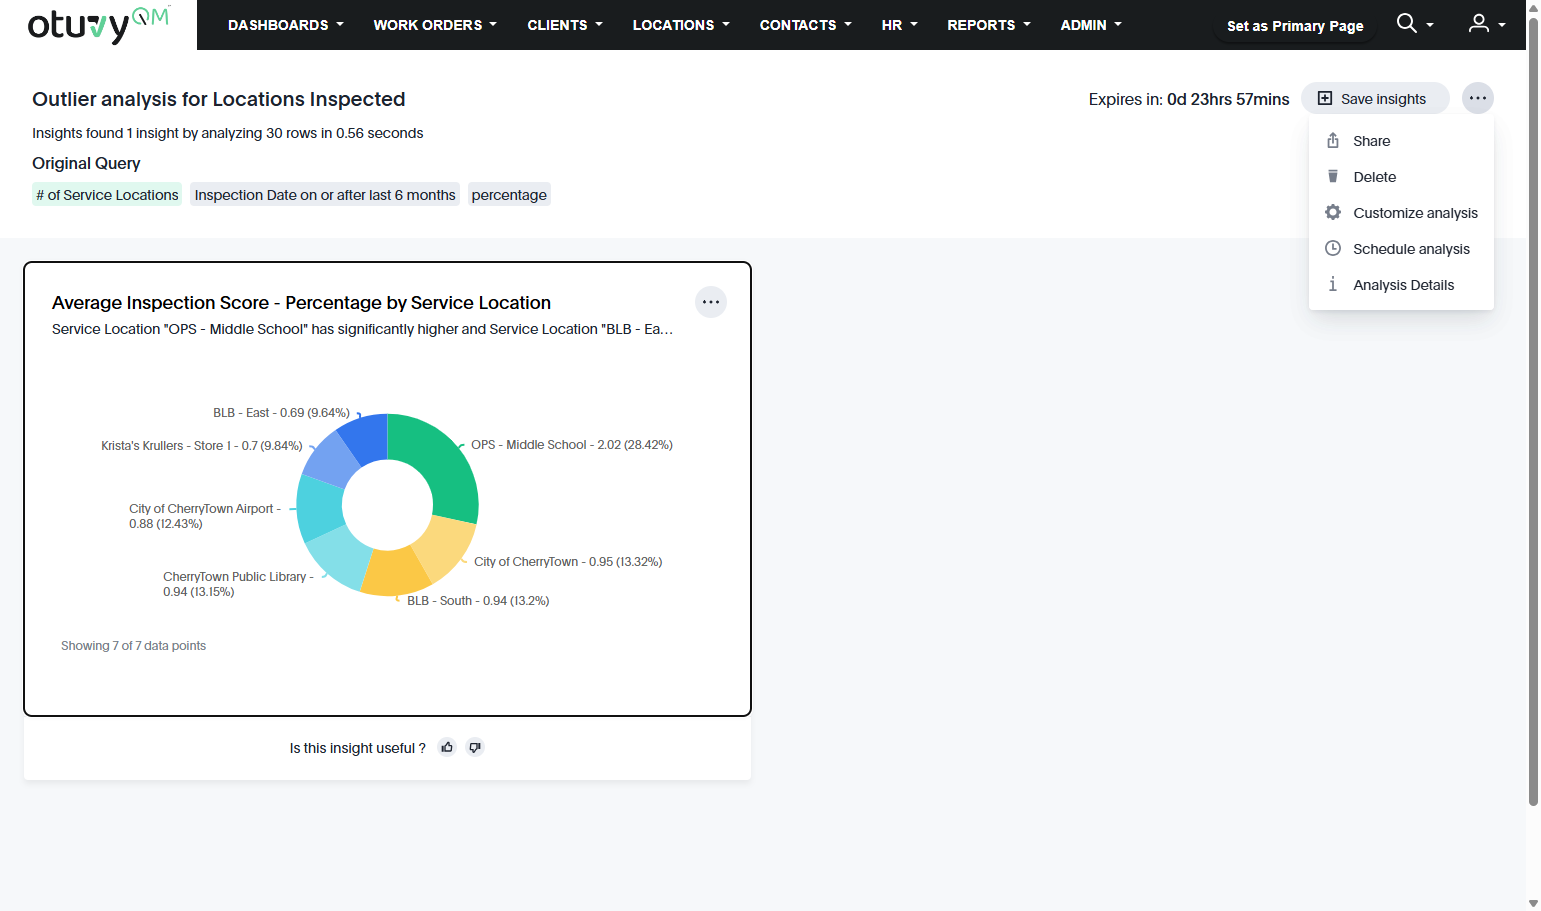
2\. Click on **Schedule analysis**
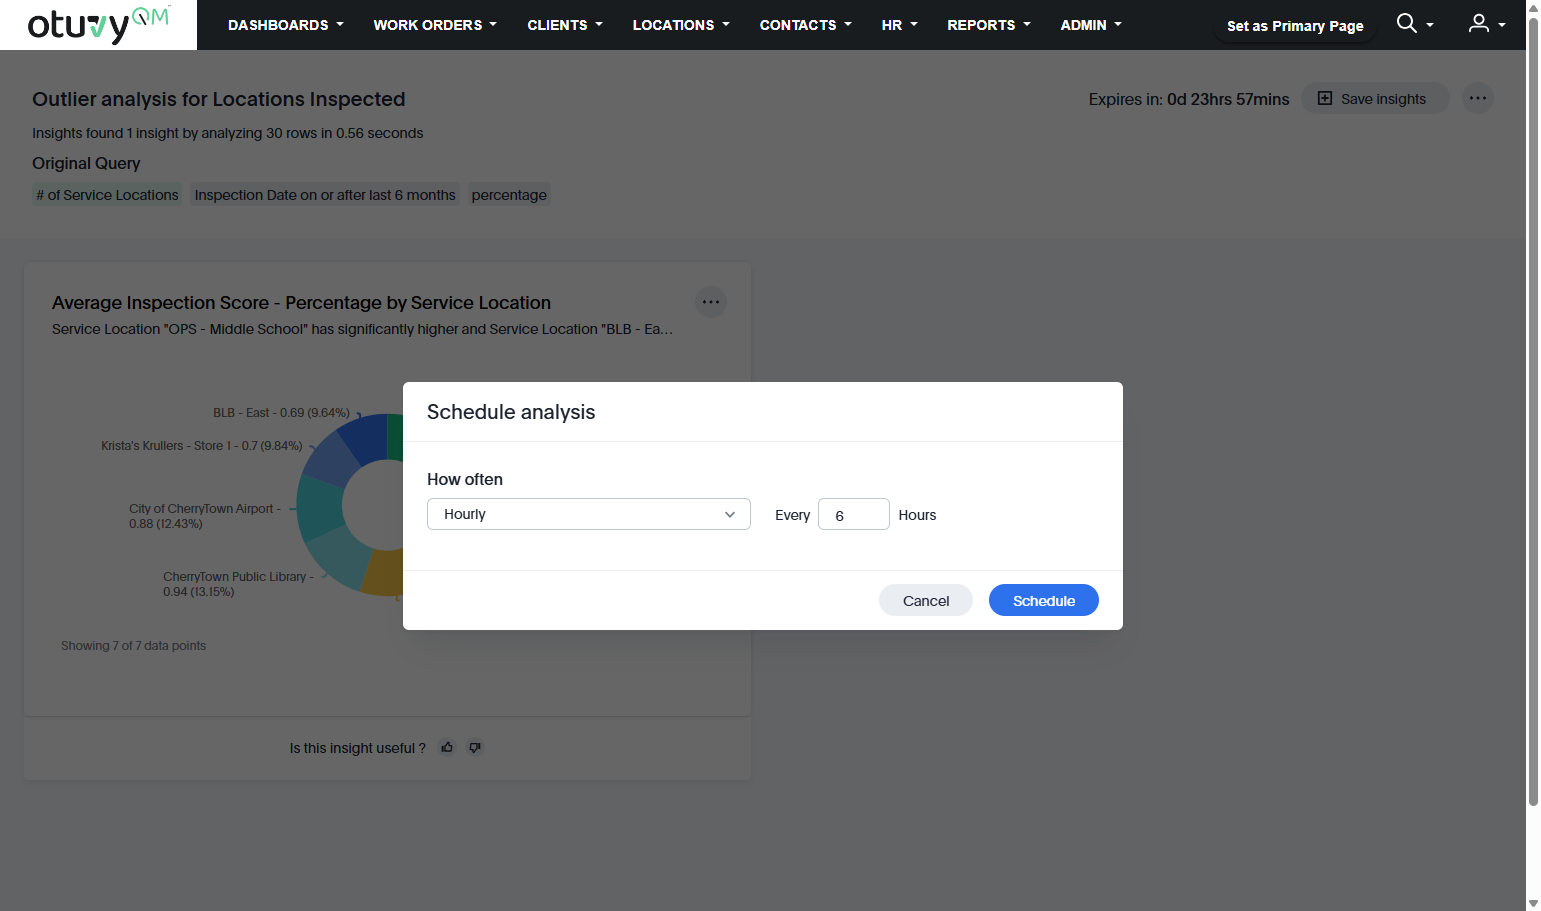
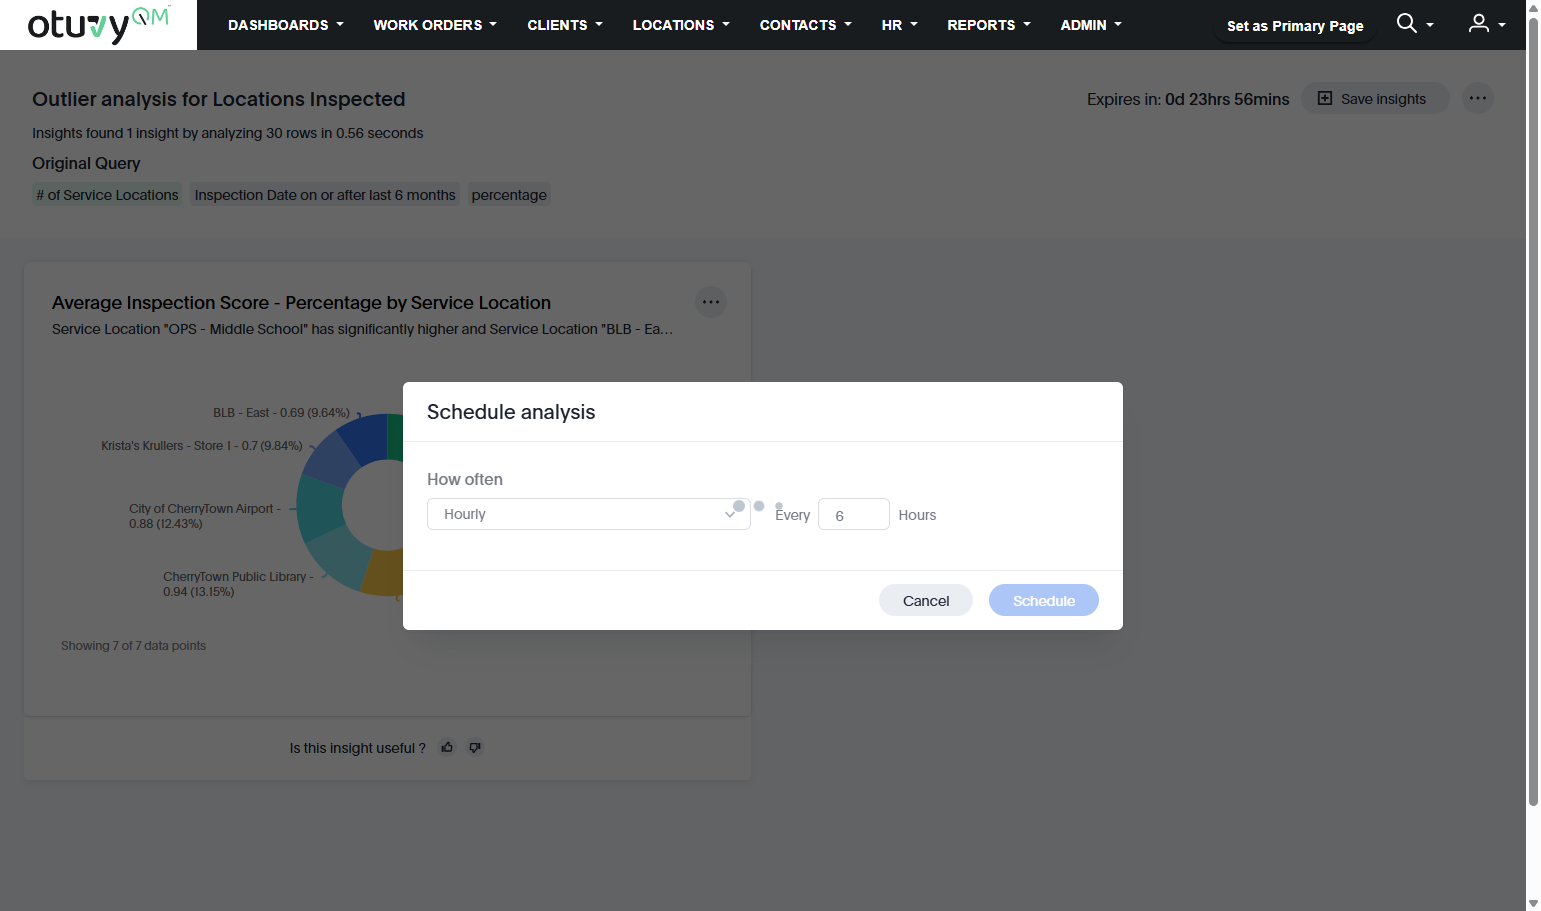
3\. Set the frequency and click on **Schedule**
## Edit Analysis Insights Preferences
To set your preferences for dashboard insights:
1\. Click on **Insights** from within the Dashboards menu dropdown
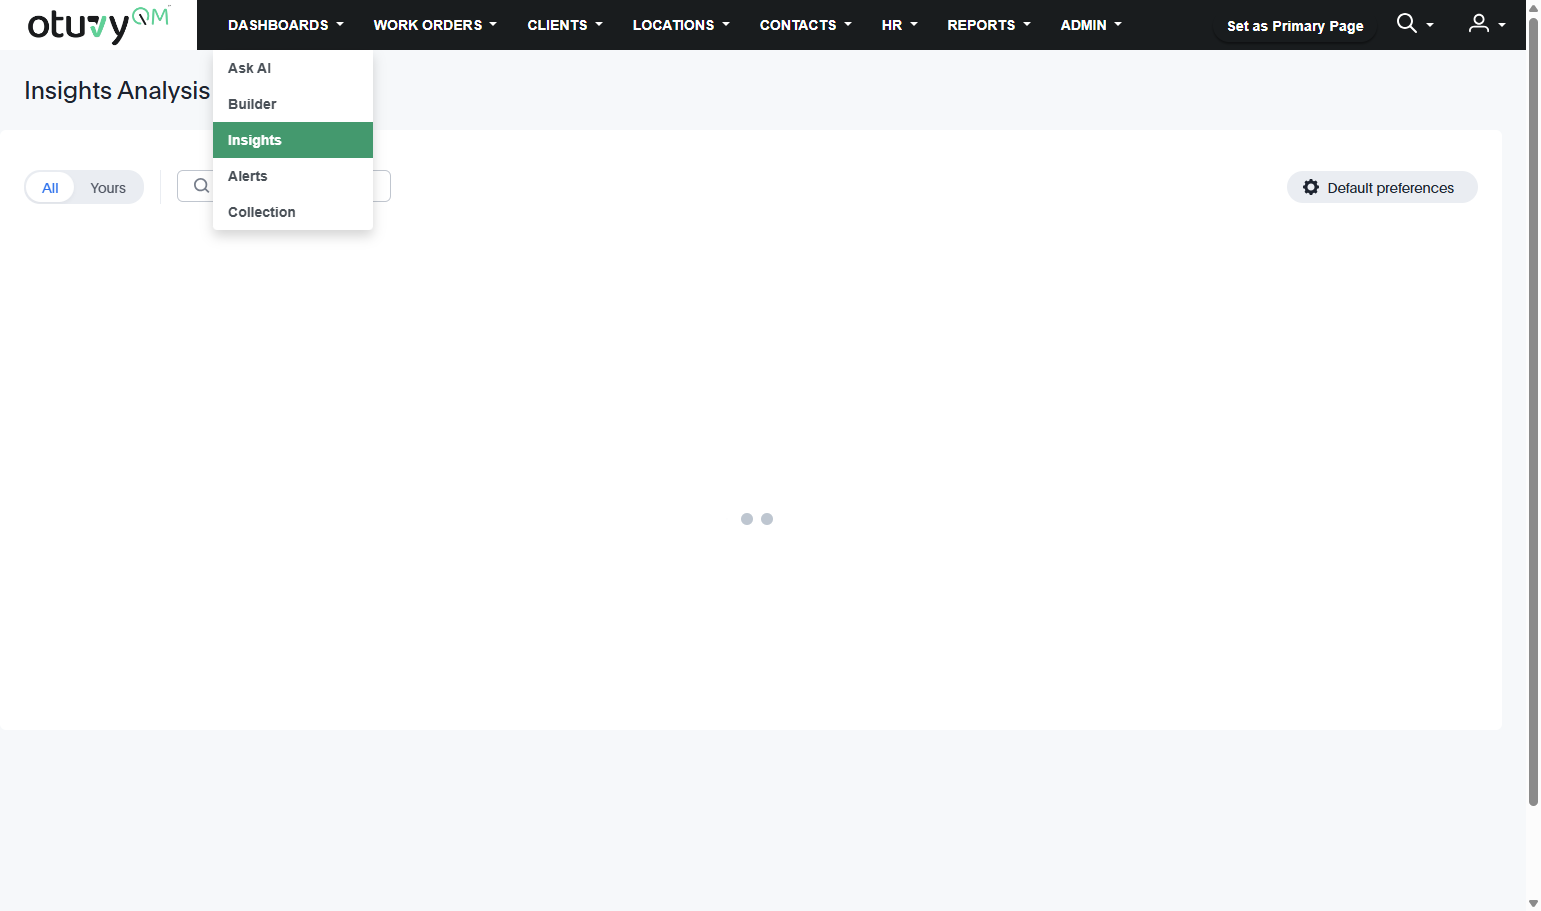
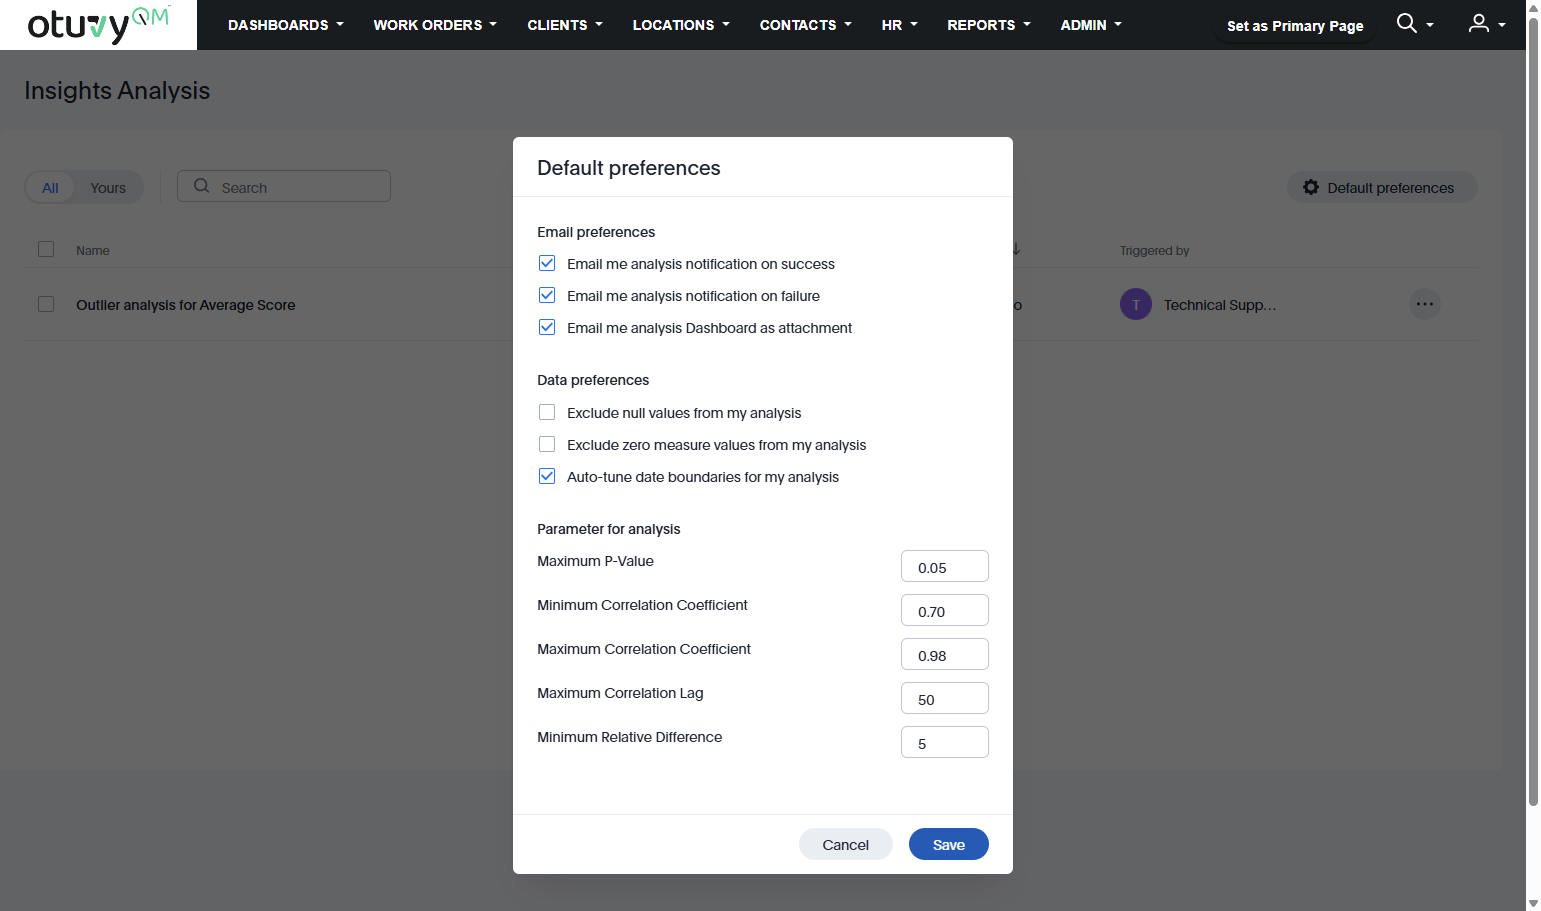
2\. Click on **Default preferences**
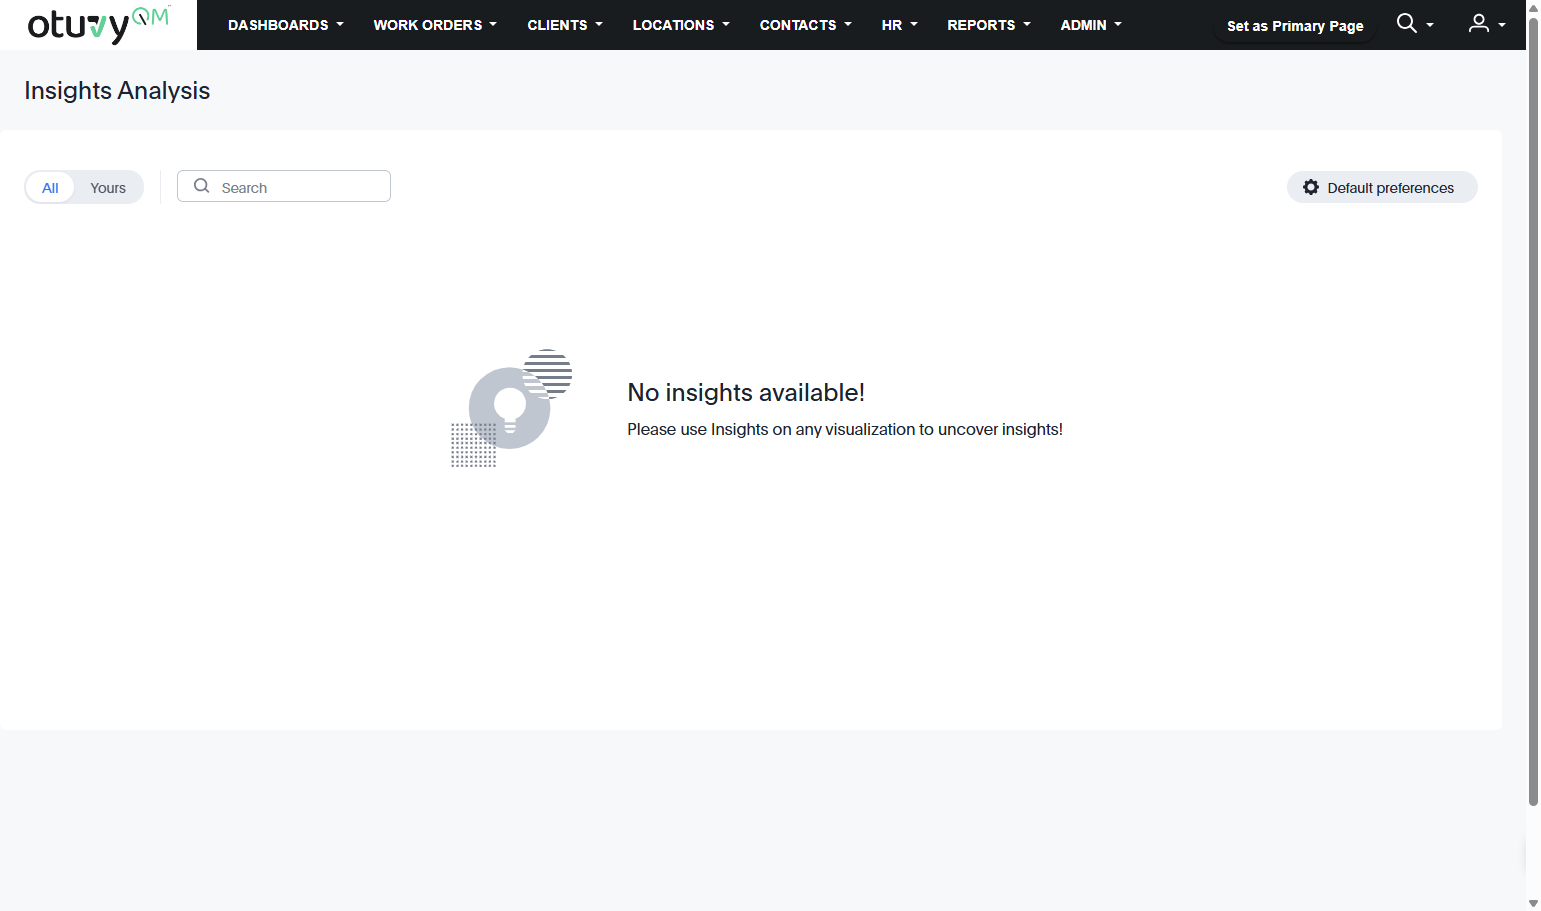
3\. Set your preferences…
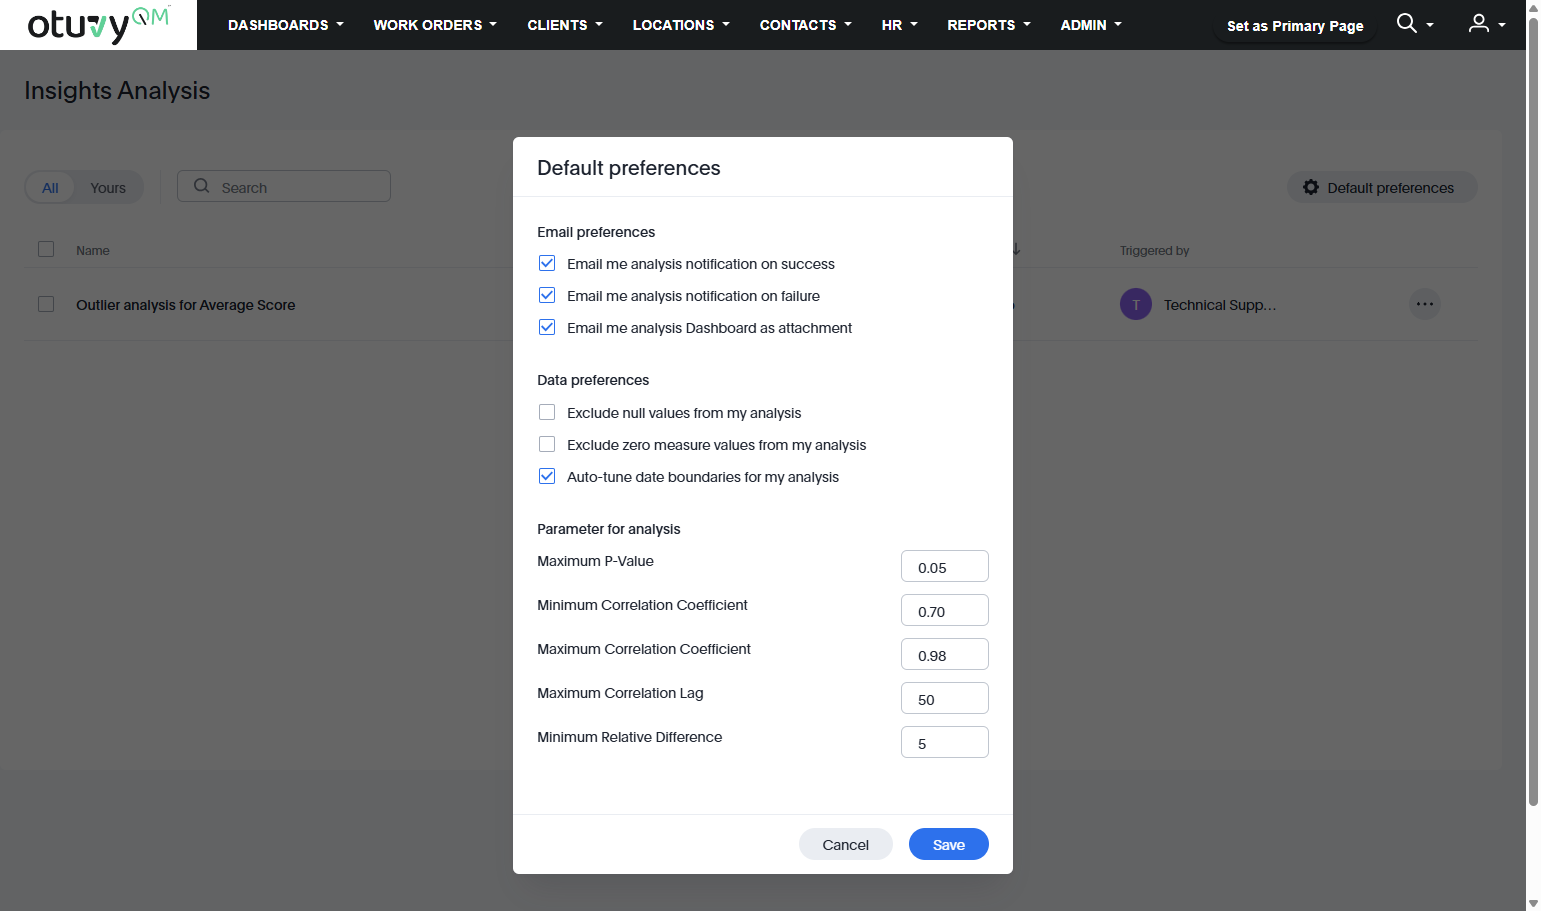
4\. and click on **Save**
- [Otuvy QM - Getting Started](https://help.otuvy.com/kb/otuvy-qm-getting-started?hsLang=en)
- [Otuvy QM - Setup & Administration](https://help.otuvy.com/kb/otuvy-qm-setup-administration?hsLang=en)
- [Otuvy QM - Contact Access](https://help.otuvy.com/kb/otuvy-qm-contact-access?hsLang=en)
- [Otuvy QM - Inspections](https://help.otuvy.com/kb/otuvy-qm-inspections?hsLang=en)
- [Otuvy QM - Work Orders](https://help.otuvy.com/kb/otuvy-qm-work-orders?hsLang=en)
- [Otuvy QM - Mobile App](https://help.otuvy.com/kb/otuvy-qm-mobile-app?hsLang=en)
- [Otuvy QM - Reports & Dashboards](https://help.otuvy.com/kb/otuvy-qm-reports-dashboards?hsLang=en)
- [Otuvy QM - Advanced Features](https://help.otuvy.com/kb/otuvy-qm-advanced-features?hsLang=en)
- [Otuvy Frontline](https://help.otuvy.com/kb/otuvy-frontline?hsLang=en#main-content)
- [Getting Started](https://help.otuvy.com/kb/otuvy-frontline?hsLang=en#getting-started)
- [Mobile App](https://help.otuvy.com/kb/otuvy-frontline?hsLang=en#mobile-app)
- [Admin Portal](https://help.otuvy.com/kb/otuvy-frontline?hsLang=en#admin-portal)
- [Uncategorized](https://help.otuvy.com/kb/uncategorized?hsLang=en)
[](https://www.otuvy.com/)
[mailto:email@email.com](mailto:email@email.com)
Copyright © 2026, Otuvy, Inc.