---
title: Creating a Custom Dashboard in Otuvy QM
description: "Build a custom dashboard in Otuvy QM: create the dashboard, pin or build dashlets, add filters, and adjust visualizations and conditional formatting."
---
[Skip to content](https://help.otuvy.com/kb/creating-a-custom-dashboard-in-otuvy-qm#main-content)
[More support](https://help.otuvy.com/kb/kb-tickets/new?hsLang=en)

Open main navigation
Close main navigation
- [More support](https://help.otuvy.com/kb/kb-tickets/new)
- [Contact us](mailto:vip@otuvy.com)
[Contact us](mailto:vip@otuvy.com)
How can we help you?
- There are no suggestions because the search field is empty.
1. [Otuvy Knowledge Base](https://help.otuvy.com/kb?hsLang=en)
2. [Otuvy QM - Reports & Dashboards](https://help.otuvy.com/kb/otuvy-qm-reports-dashboards?hsLang=en)
# Creating a Custom Dashboard in Otuvy QM
# Creating a Custom Dashboard in Otuvy QM
Creating a custom dashboard in Otuvy QM empowers you to transform raw data into actionable insights. This guide walks you through the process of setting up a personalized dashboard, where you can add and customize dashlets, apply filters, and modify visualizations to suit your specific needs. Whether you're looking to track quality metrics or monitor inspection trends, this tutorial provides clear, step-by-step instructions that simplify even the most complex configurations.
In this comprehensive walkthrough, you'll learn how to navigate the dashboard collection, create new dashboards, and efficiently pin dashlets from various sources. You'll also explore advanced customization options like adjusting filter settings and conditional formatting, ensuring your dashboard not only looks great but also delivers the precise data insights you require. Enjoy a seamless journey towards a more efficient and insightful data visualization experience with Otuvy QM.
## Creating a New Dashboard
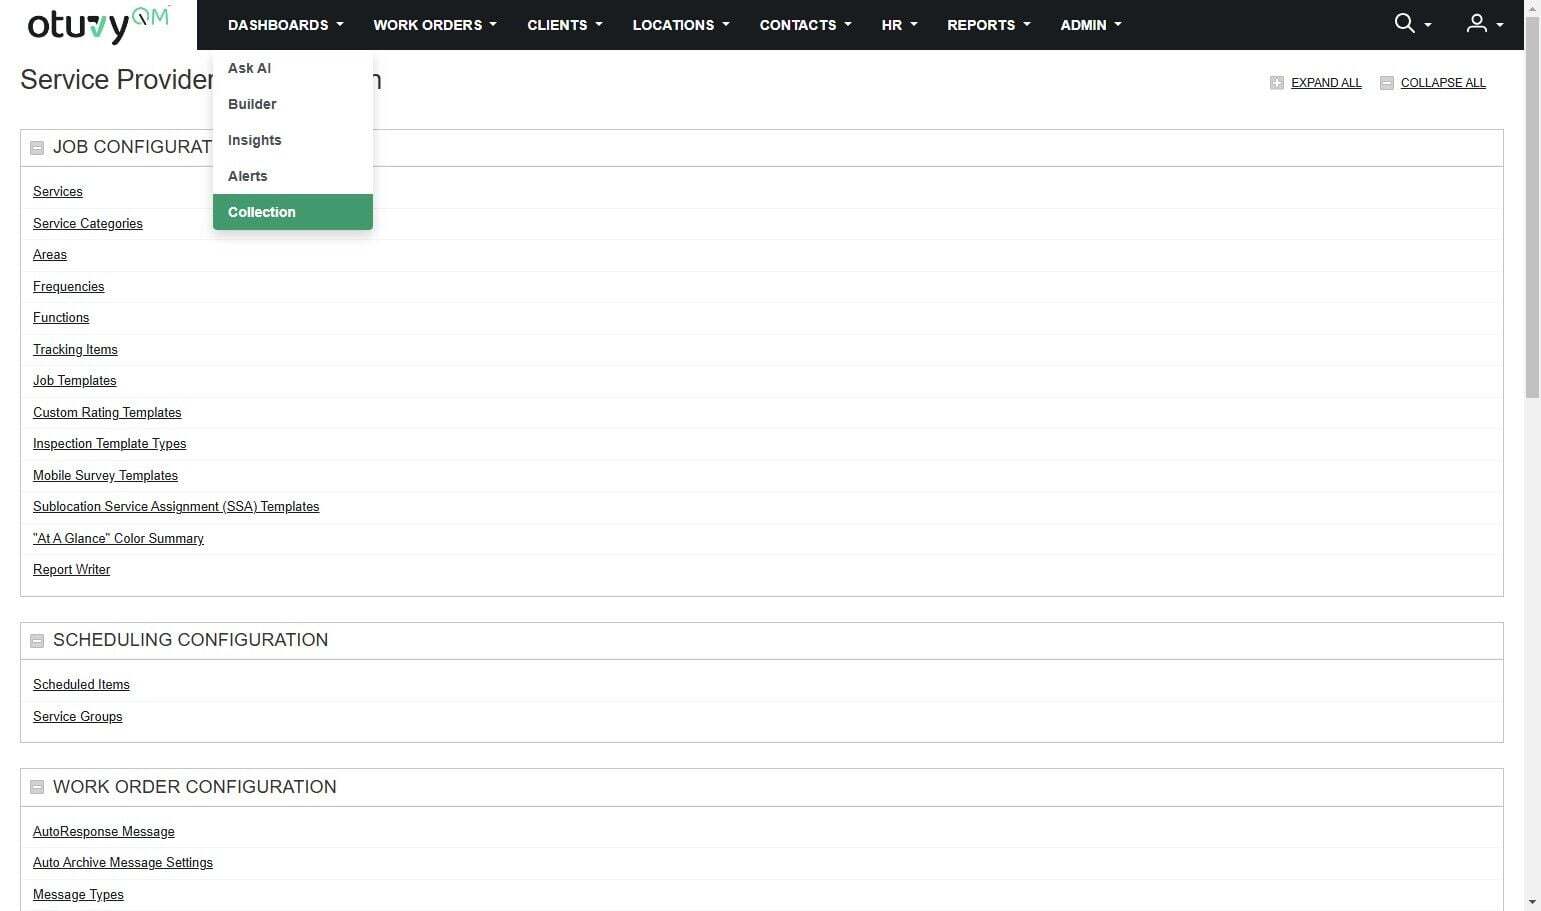
You can create new dashboards from within the Dashboard Collection page. Navigate to your Dashboard Collection by hovering over Dashboard in the main navigation and then click "Collection"
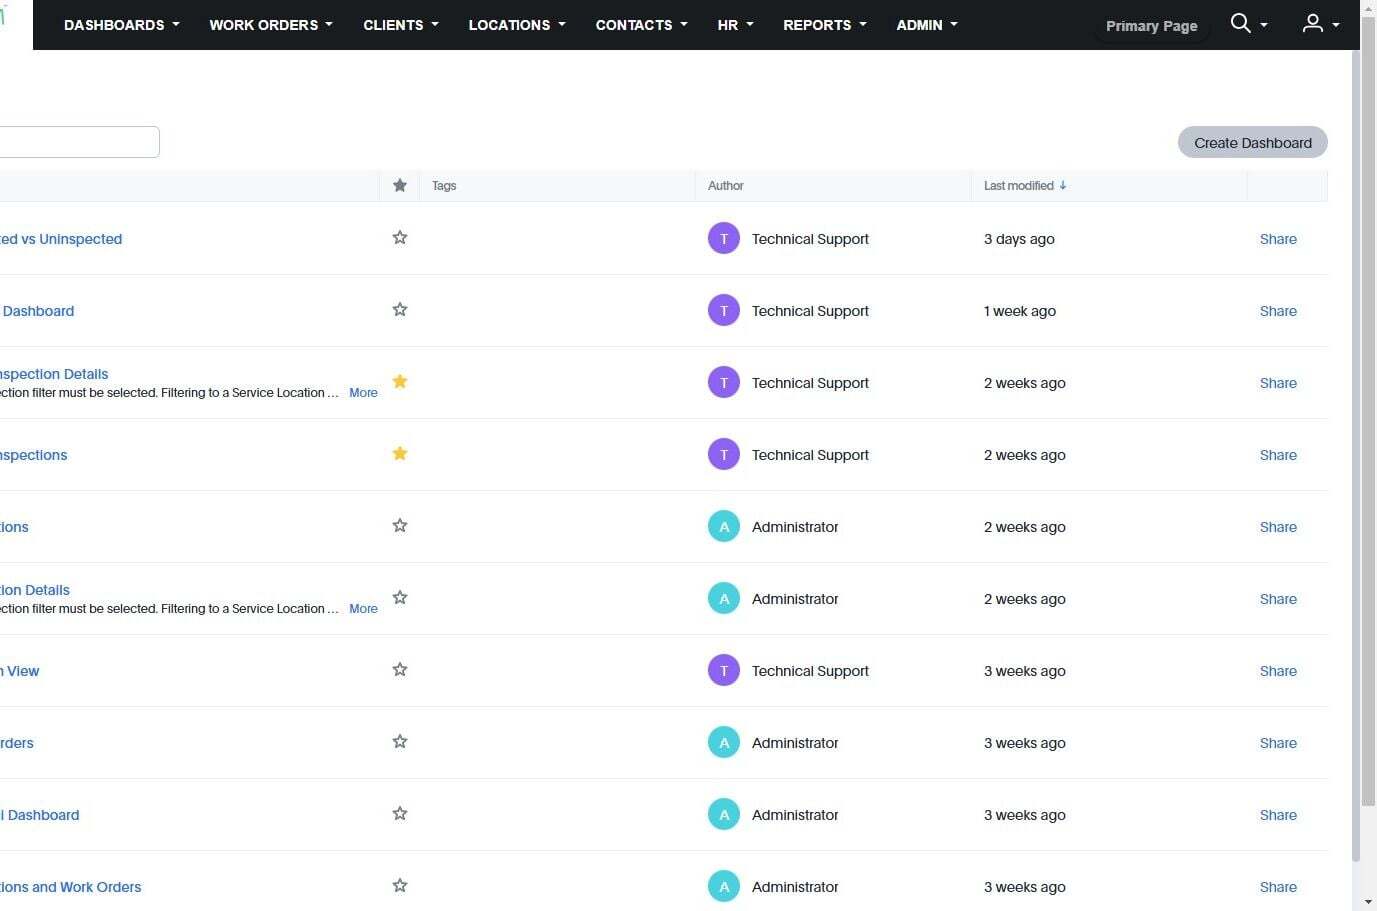
On the right side of this page, click "Create Dashboard"
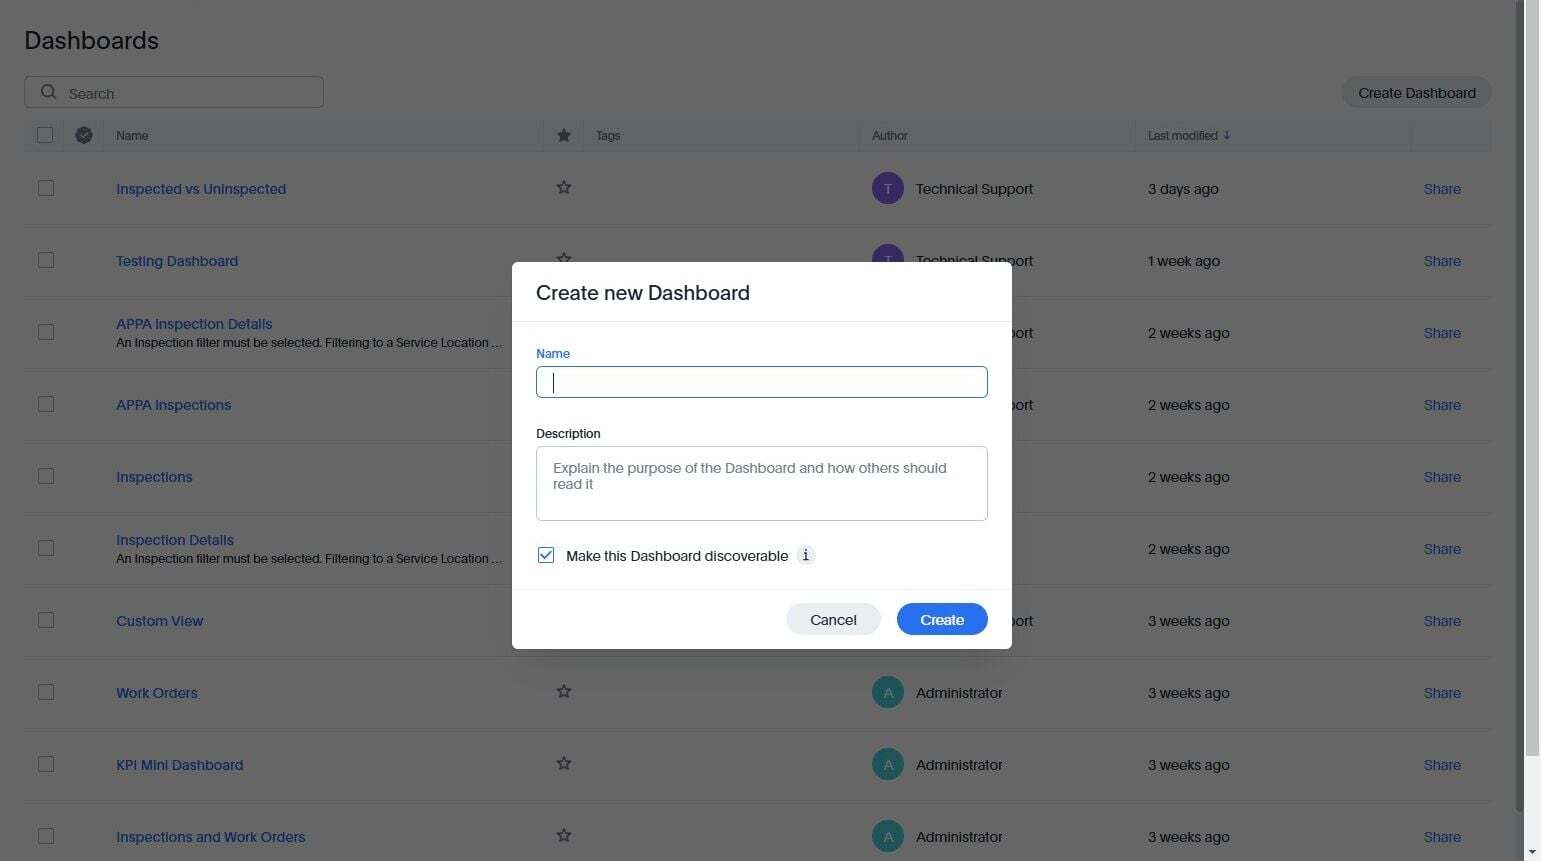
Give your new dashboard a name
Click "Make this Dashboard discoverable" to remove this checkbox. A discoverable dashboard can be seen by others without sharing the dashboard with them.
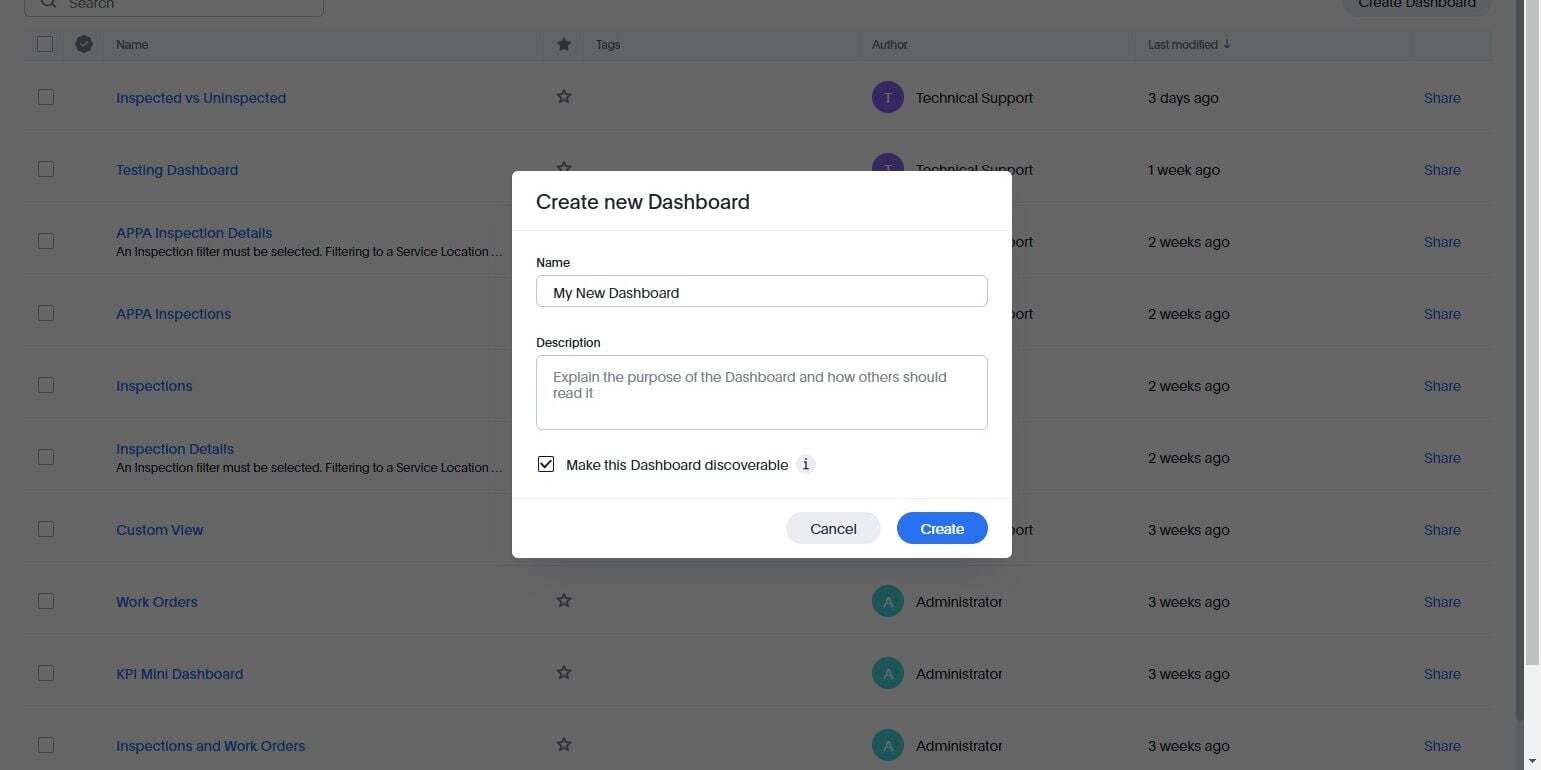
With "Make this Dashboard discoverable" deselected, you can set up your dashboard and choose who to share it with and when to share it with them.
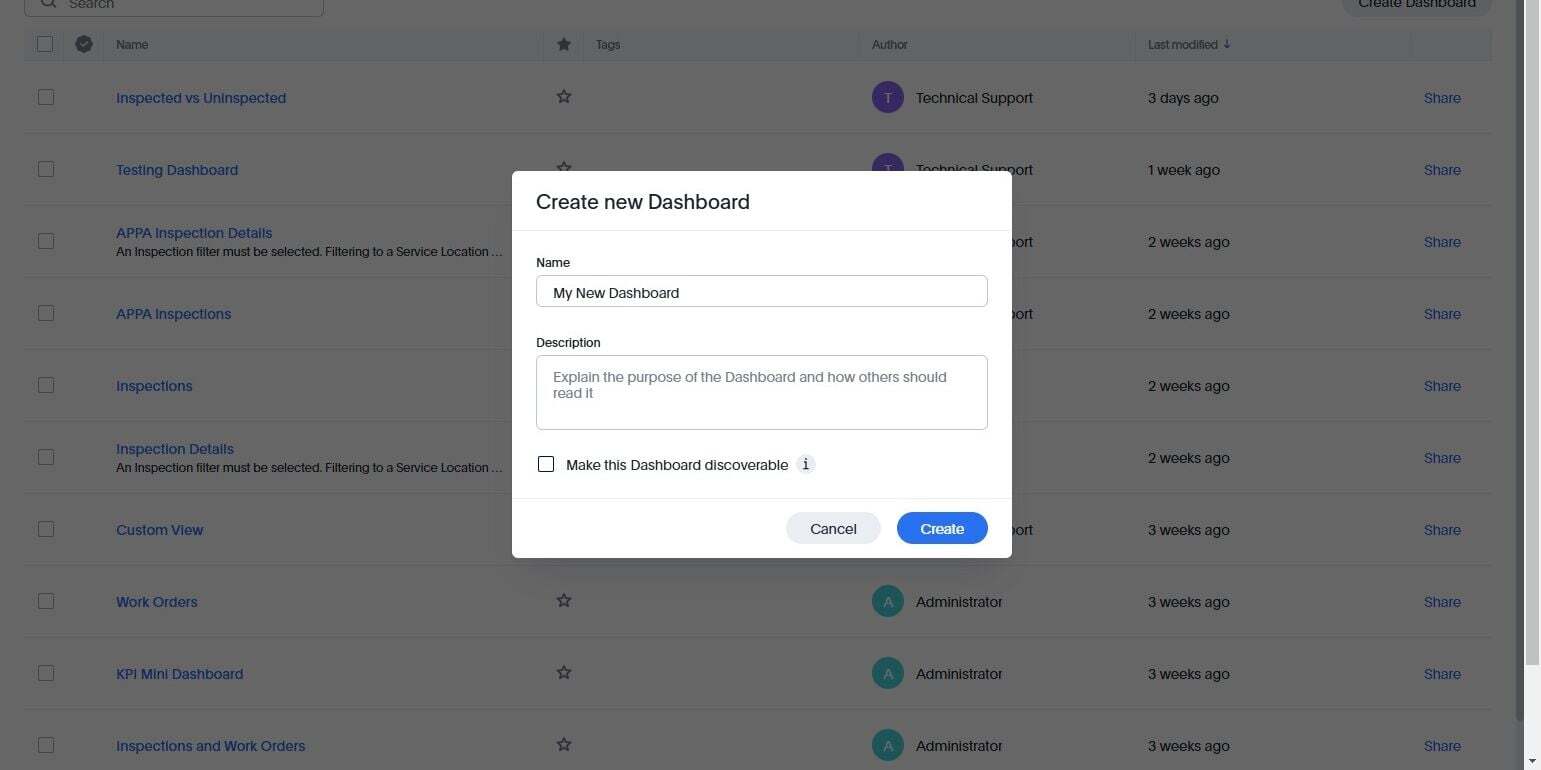
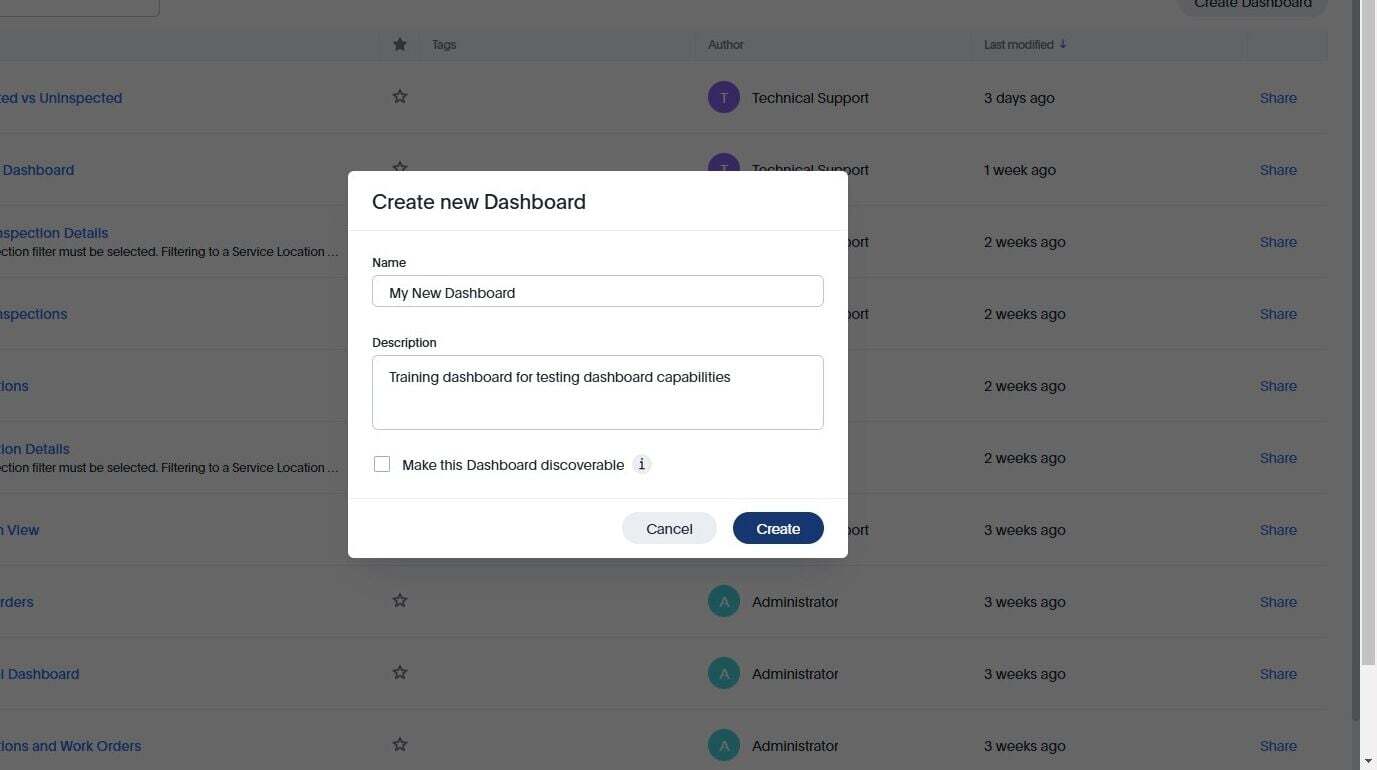
Enter an optional description for the dashboard
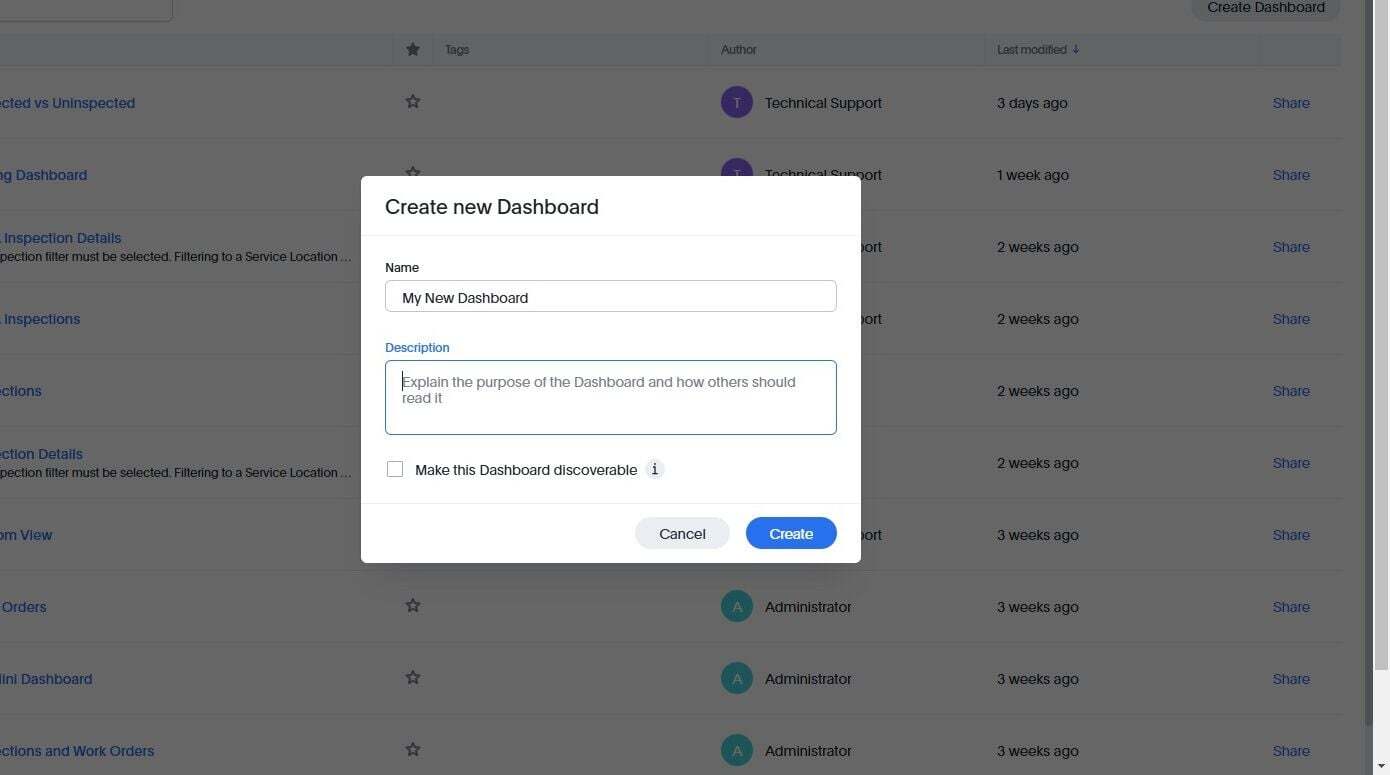
Once it looks right, click "Create"
## Pin a Dashlet
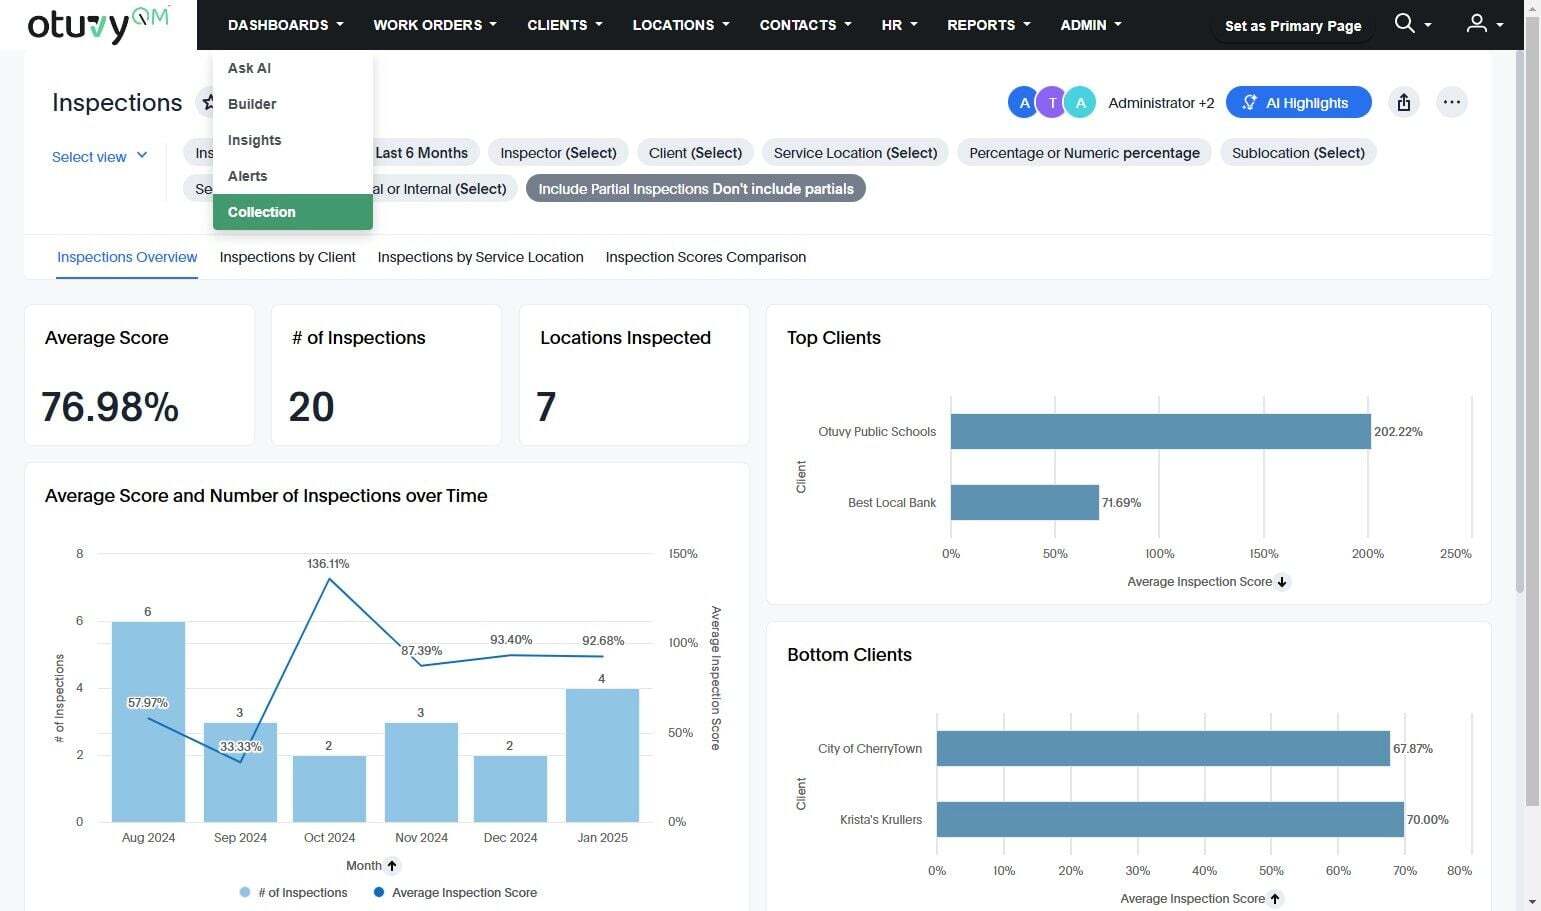
Our new dashboard is empty, lets find a dashlet we want to add to it. In this case we're going to select something that already exists. Lets find one within the Dashboard Collection. Hover over Dashboards in the main navigation and click "Collection"
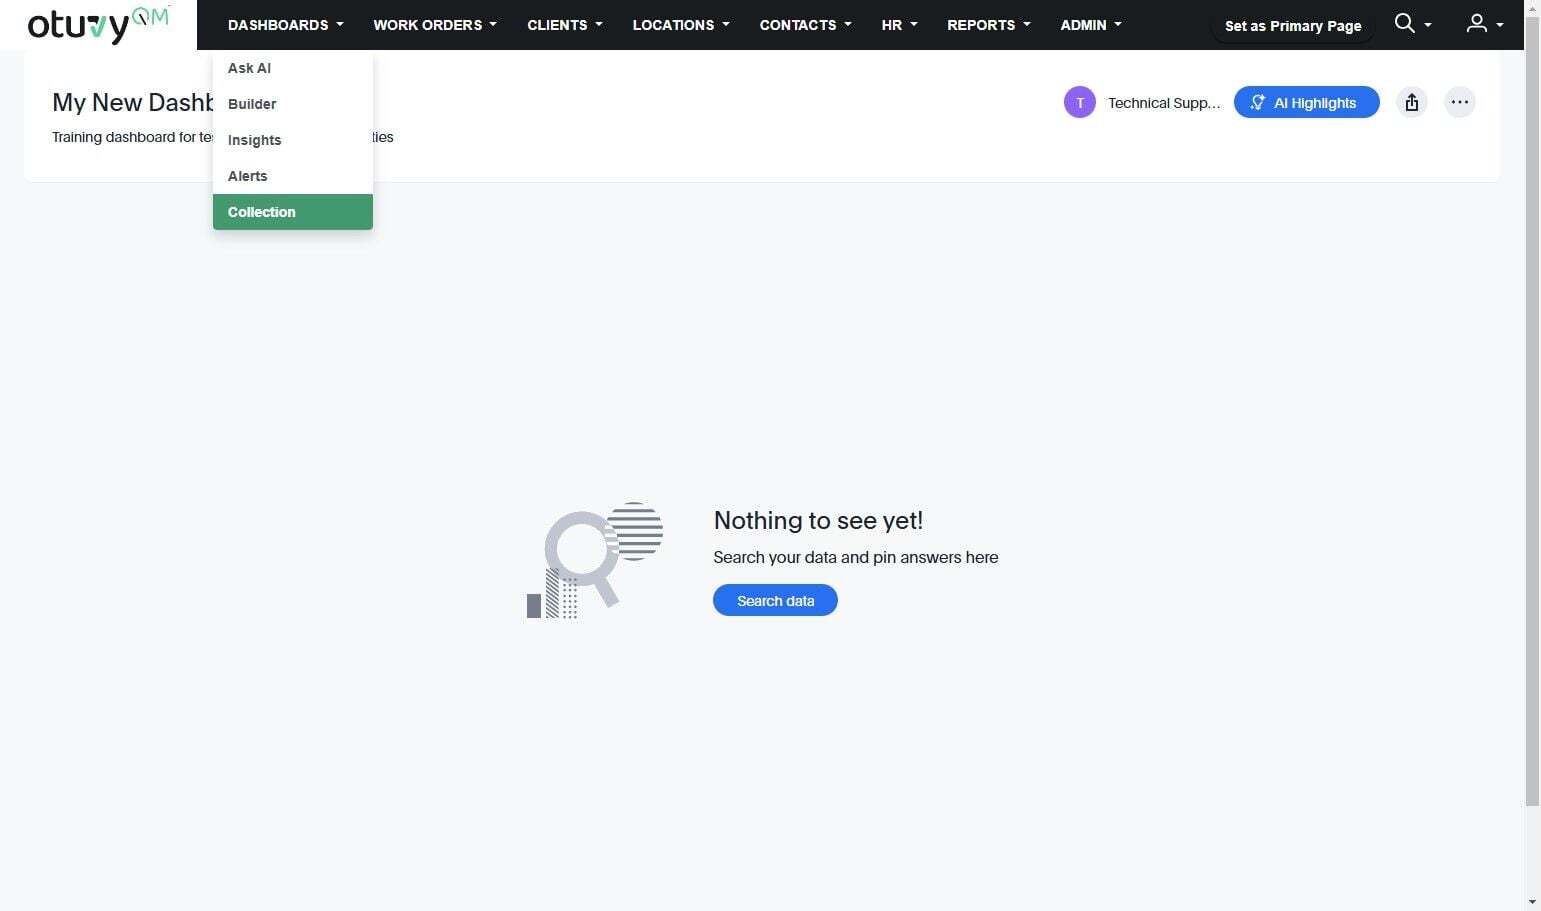
You can pin any dashlet you from any of your dashboards. In this example we're going to pin the "Average Score and Number of Inspections over Time" dashlet from the Inspections dashboard. To get that dashlet, click "Inspections"
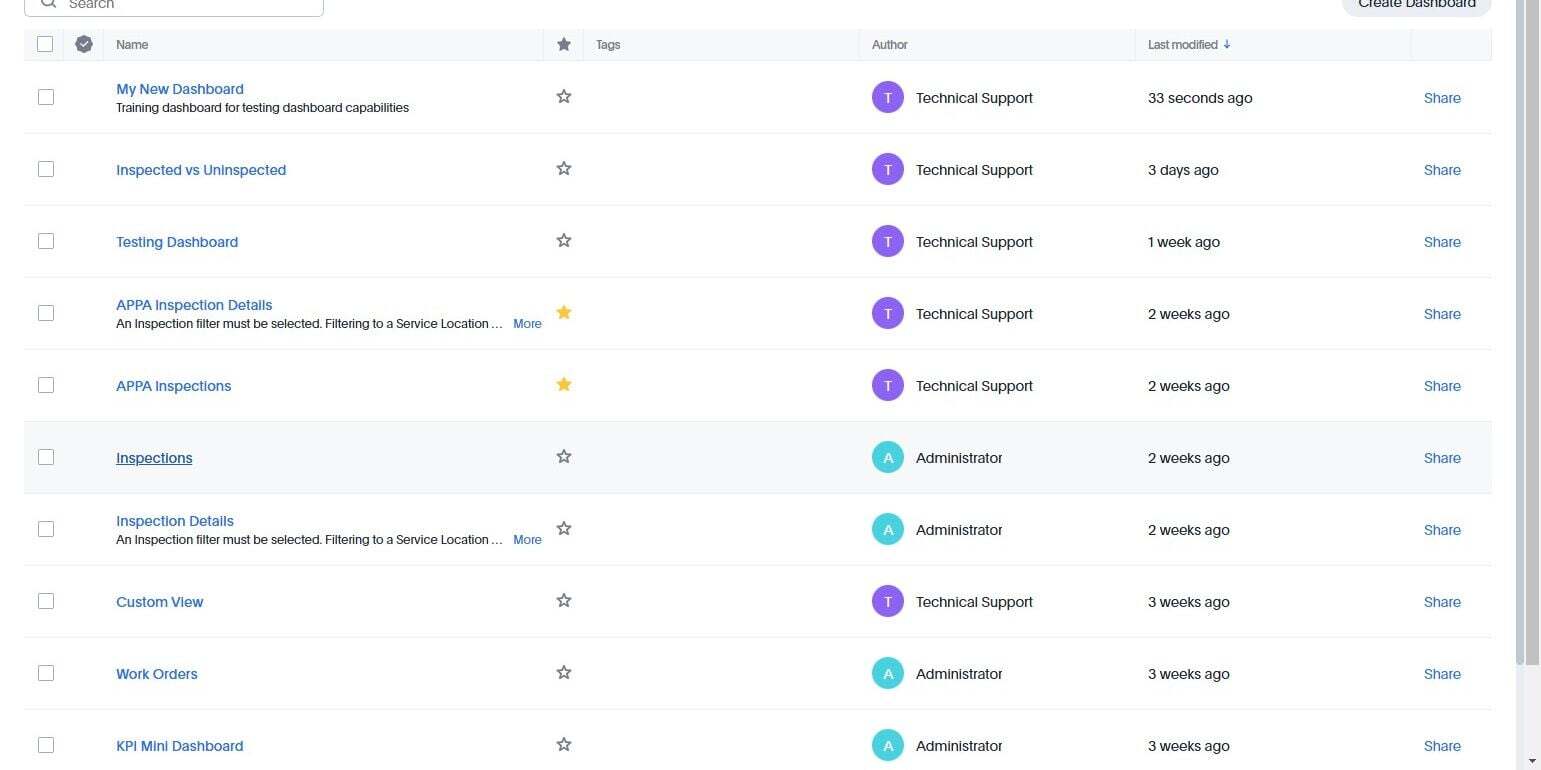
Hover your cursor over the "Average Score and Number of Inspections over Time" dashboard and click this icon to show the menu for this dashlet.
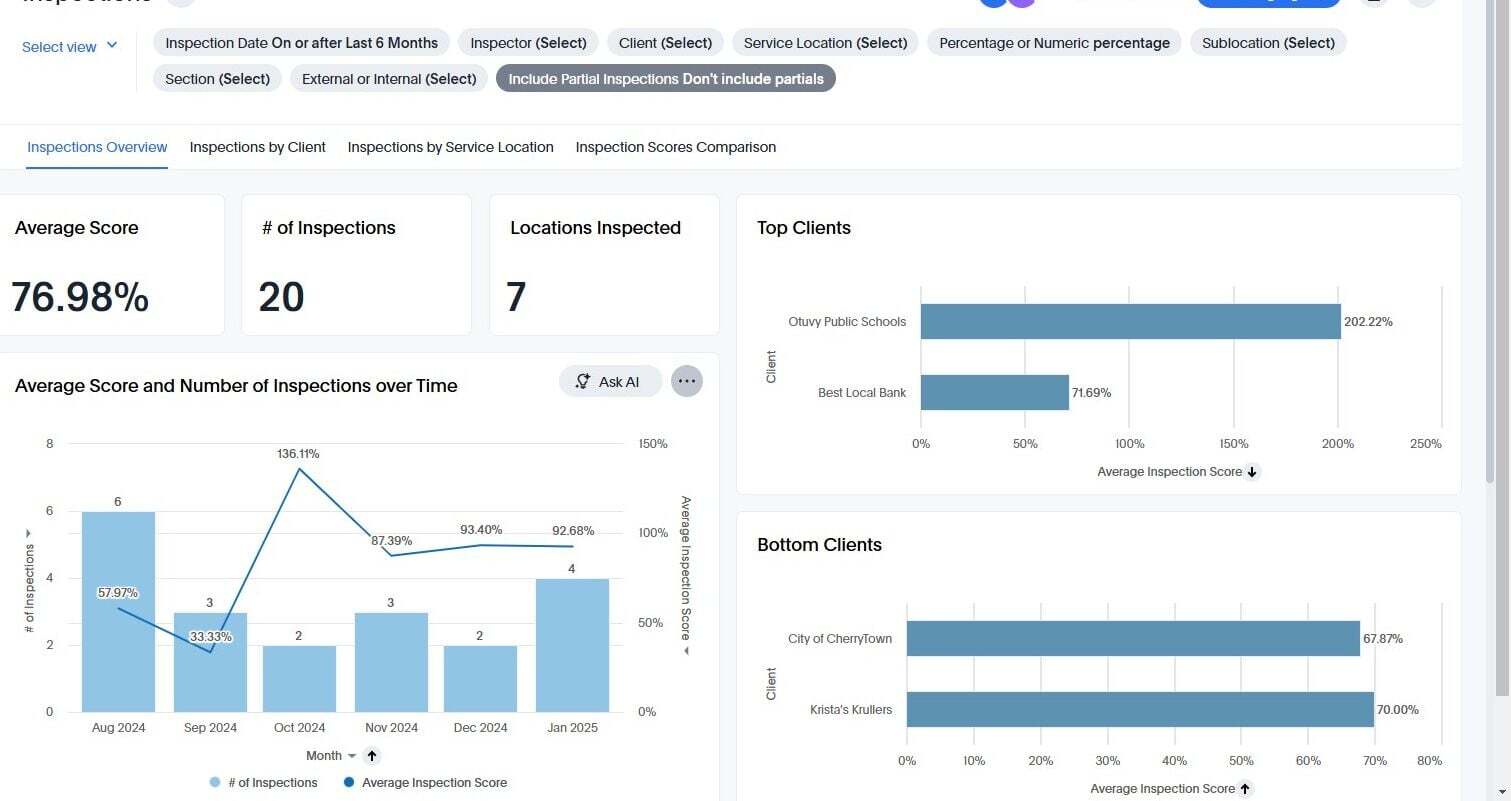
Click "Pin" from the menu that appears
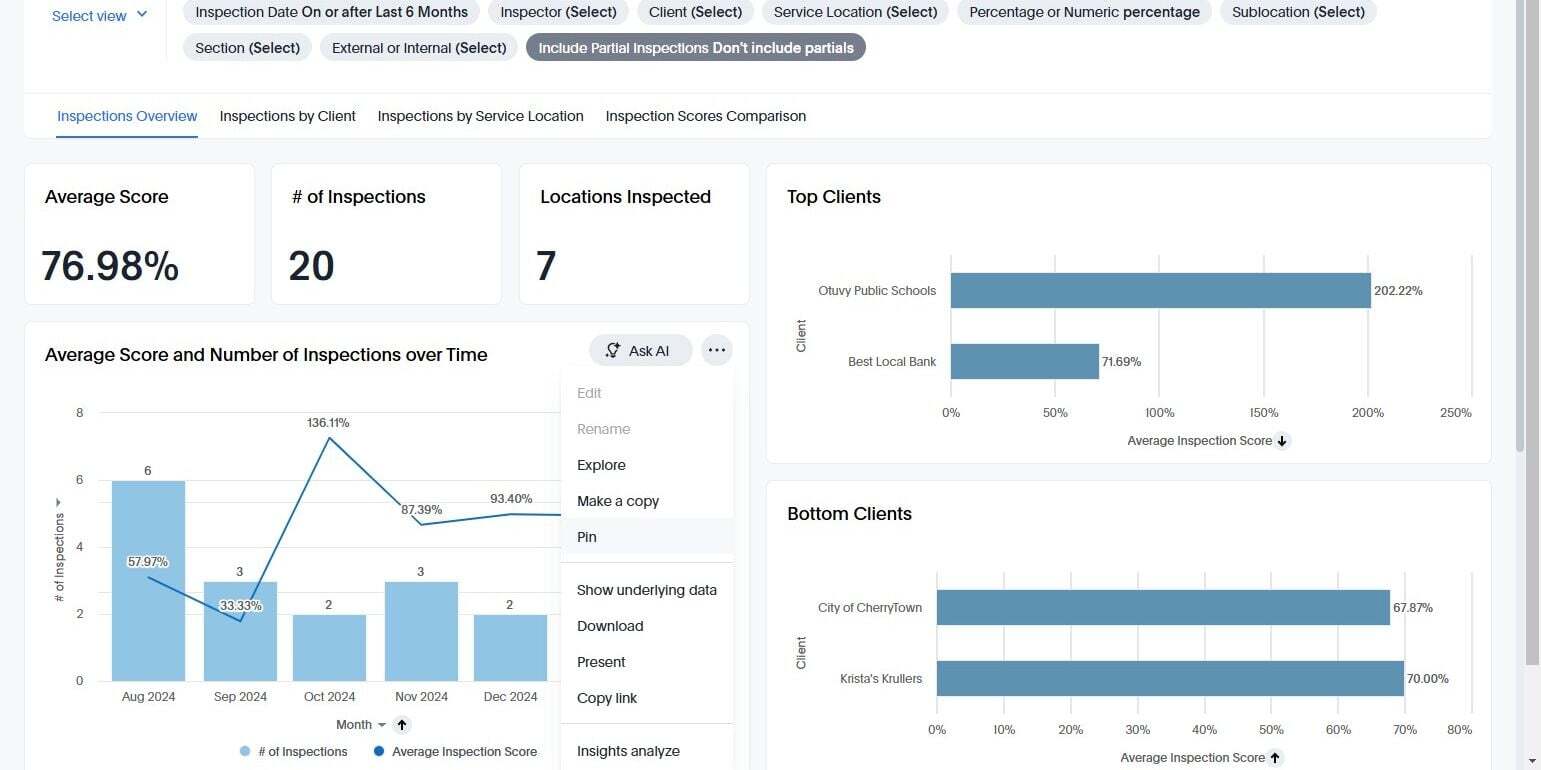
Select the dashboard you want to pin the dashlet to.
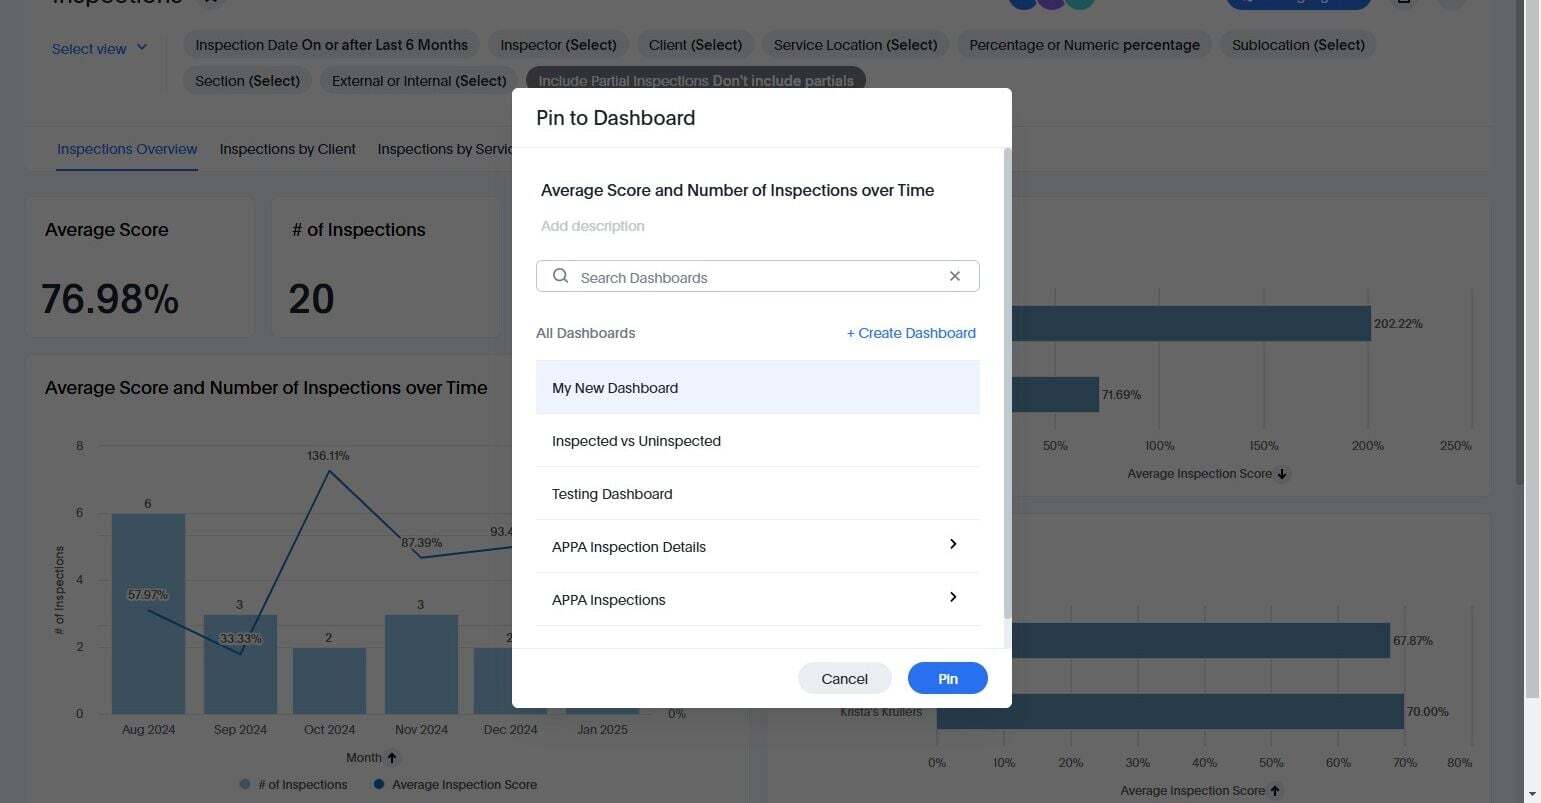
and then click "Pin"
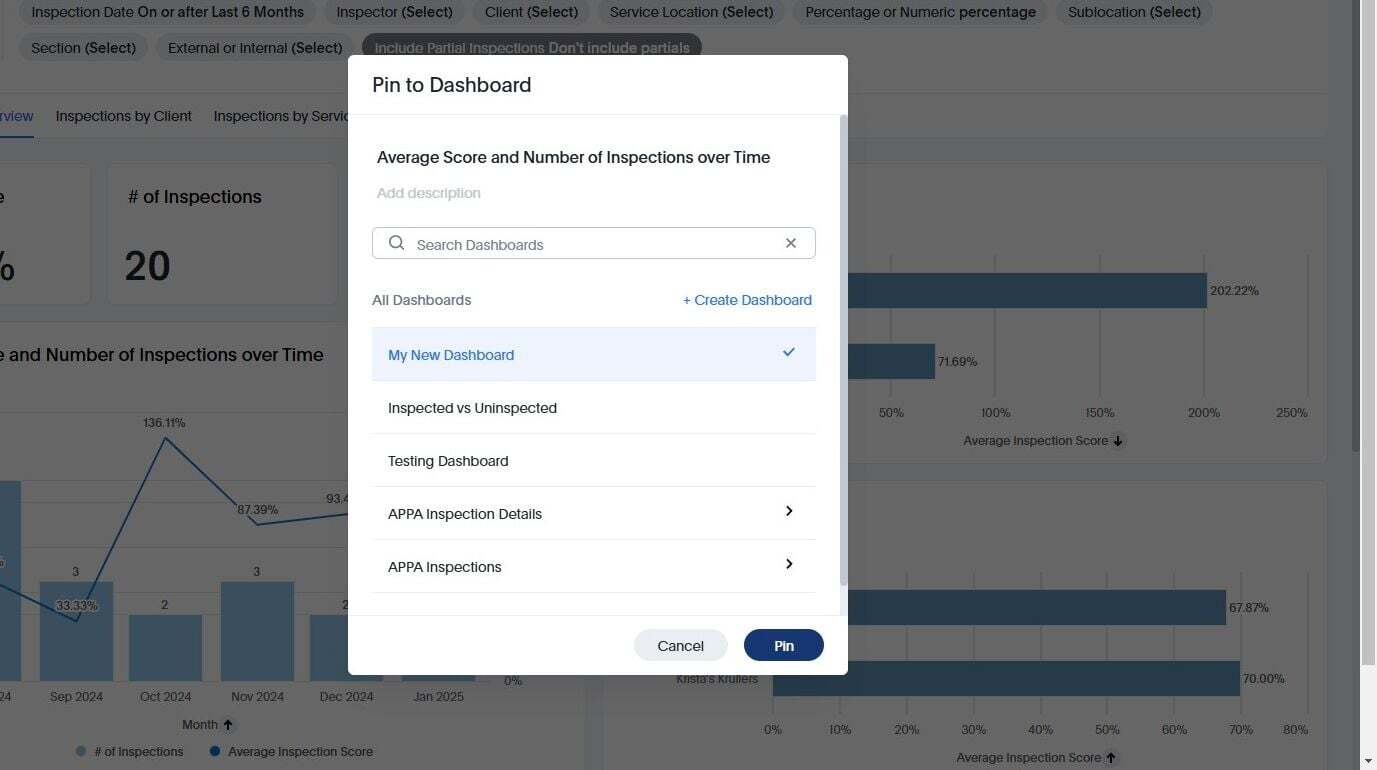
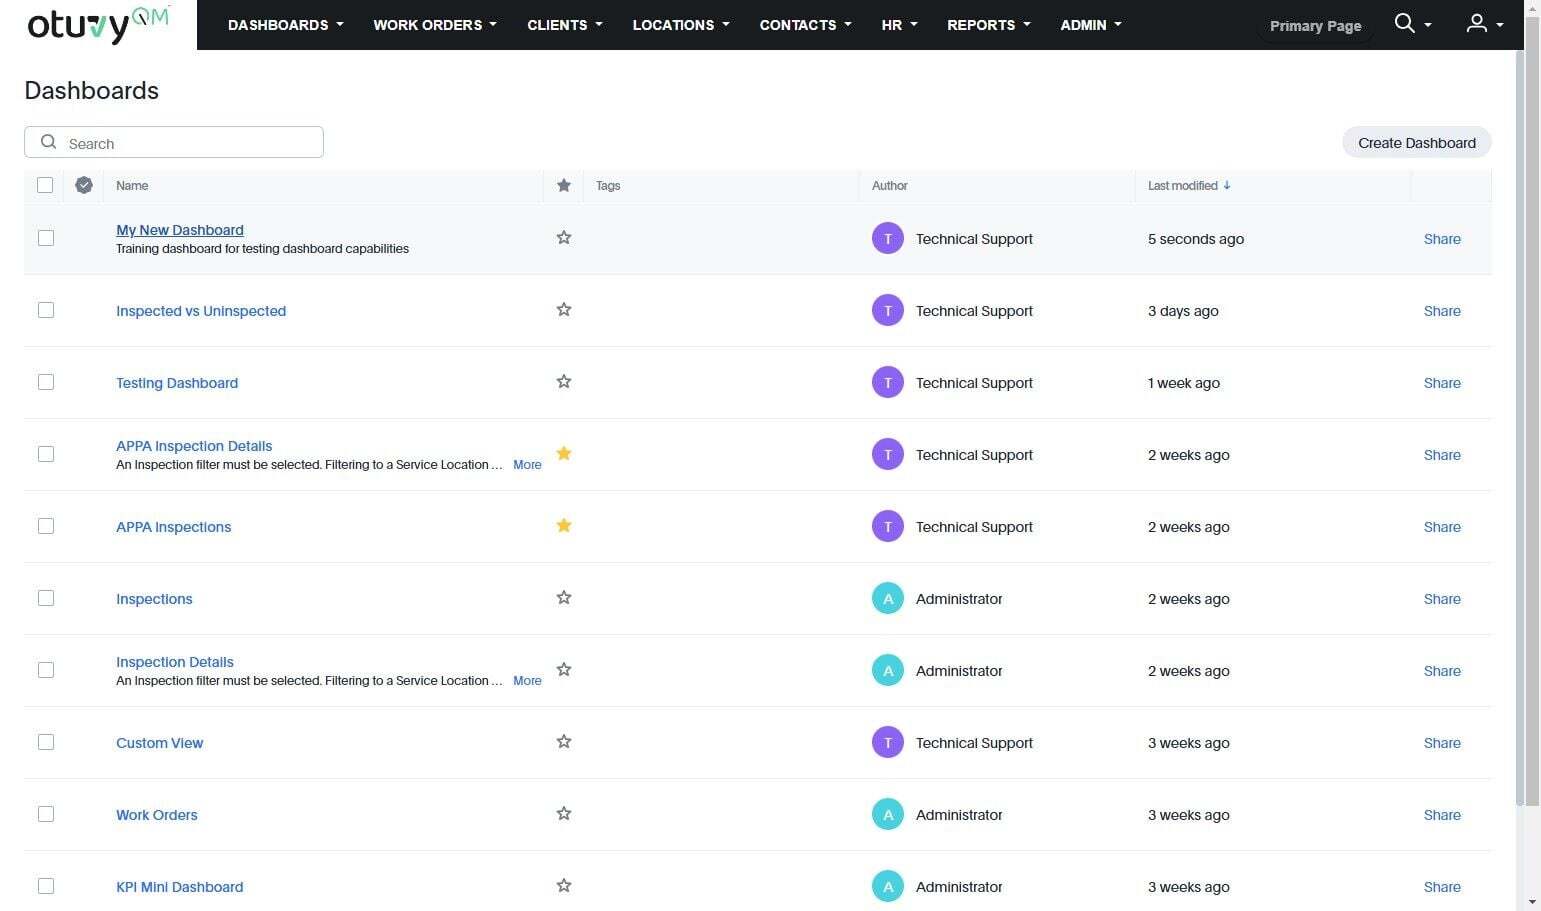
The dashlet has been added to the "My New Dashboard" dashboard. Lets go see! Navigate to the Dashboards Collection page
Click on the dashboard where you pinned the dashlet
The dashlet was added to the new dashboard but no data is being brought in. Lets add some filters to the dashboard so we know its pulling in some good data. To do this we have to edit the dashboard. Start by clicking this icon at the top-right of the screen.
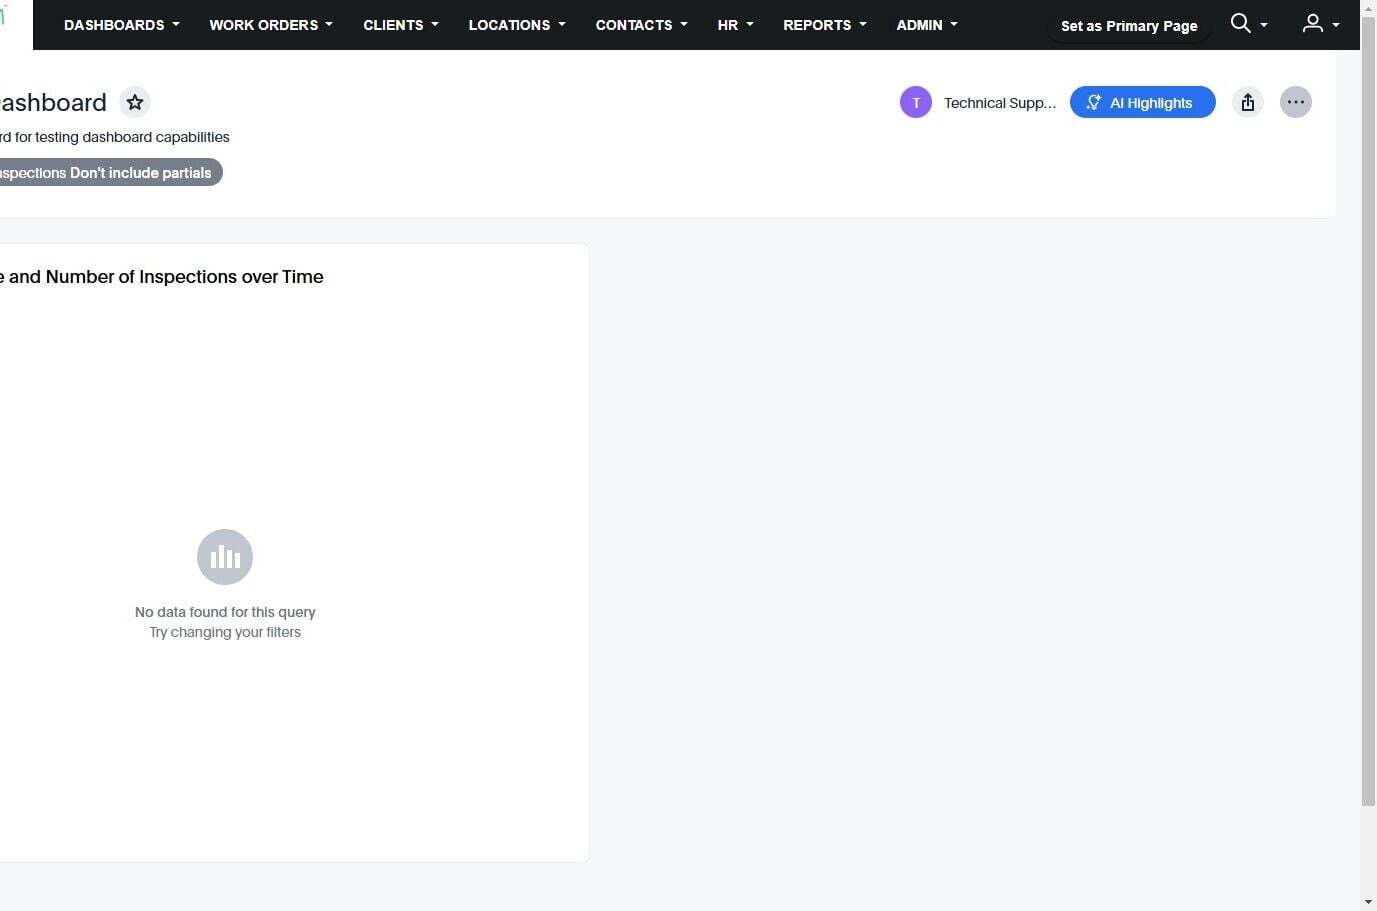
Click "Edit" from the menu that appears
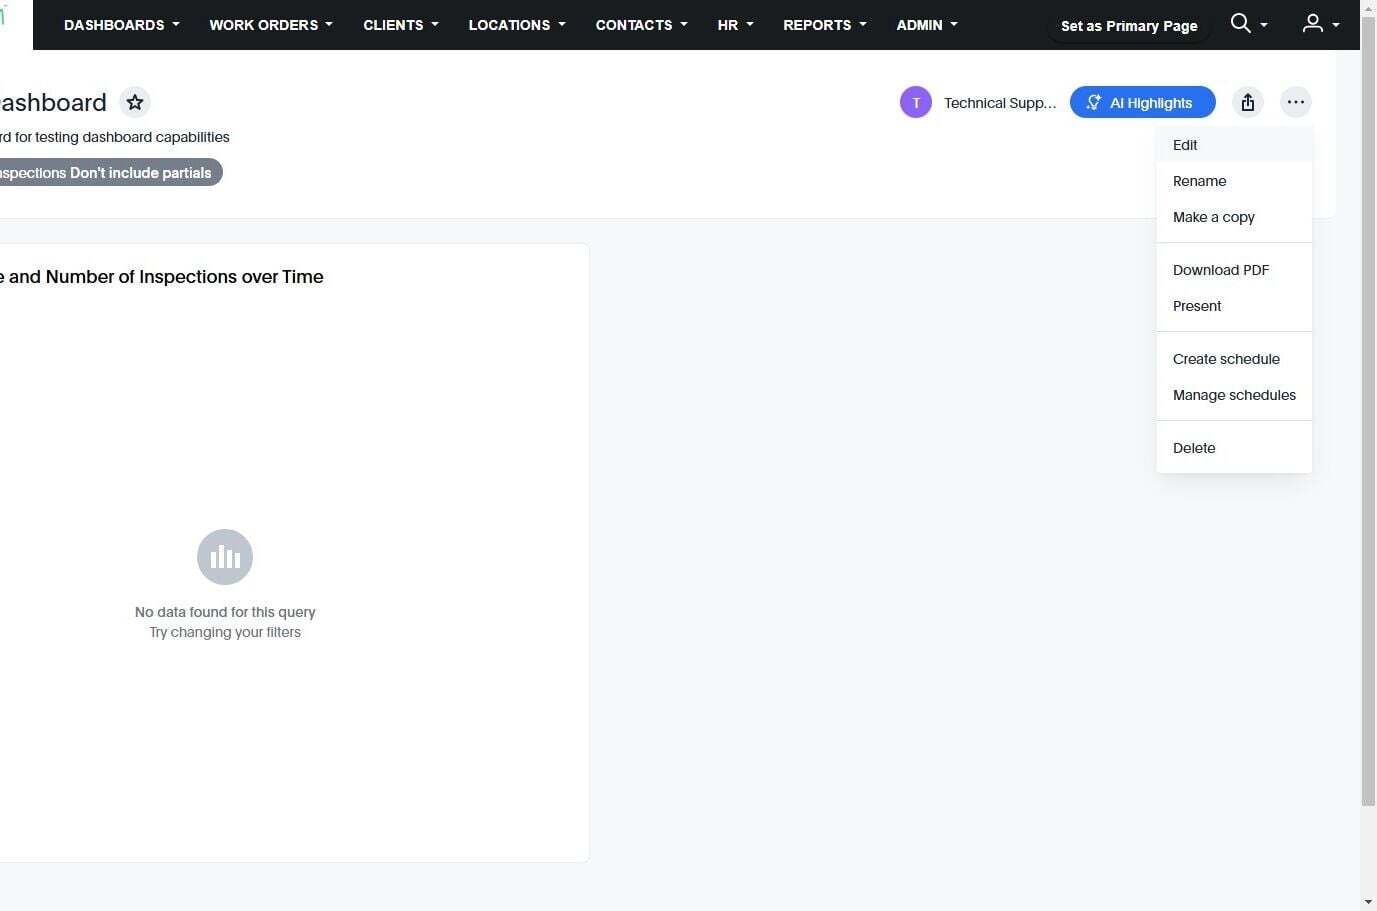
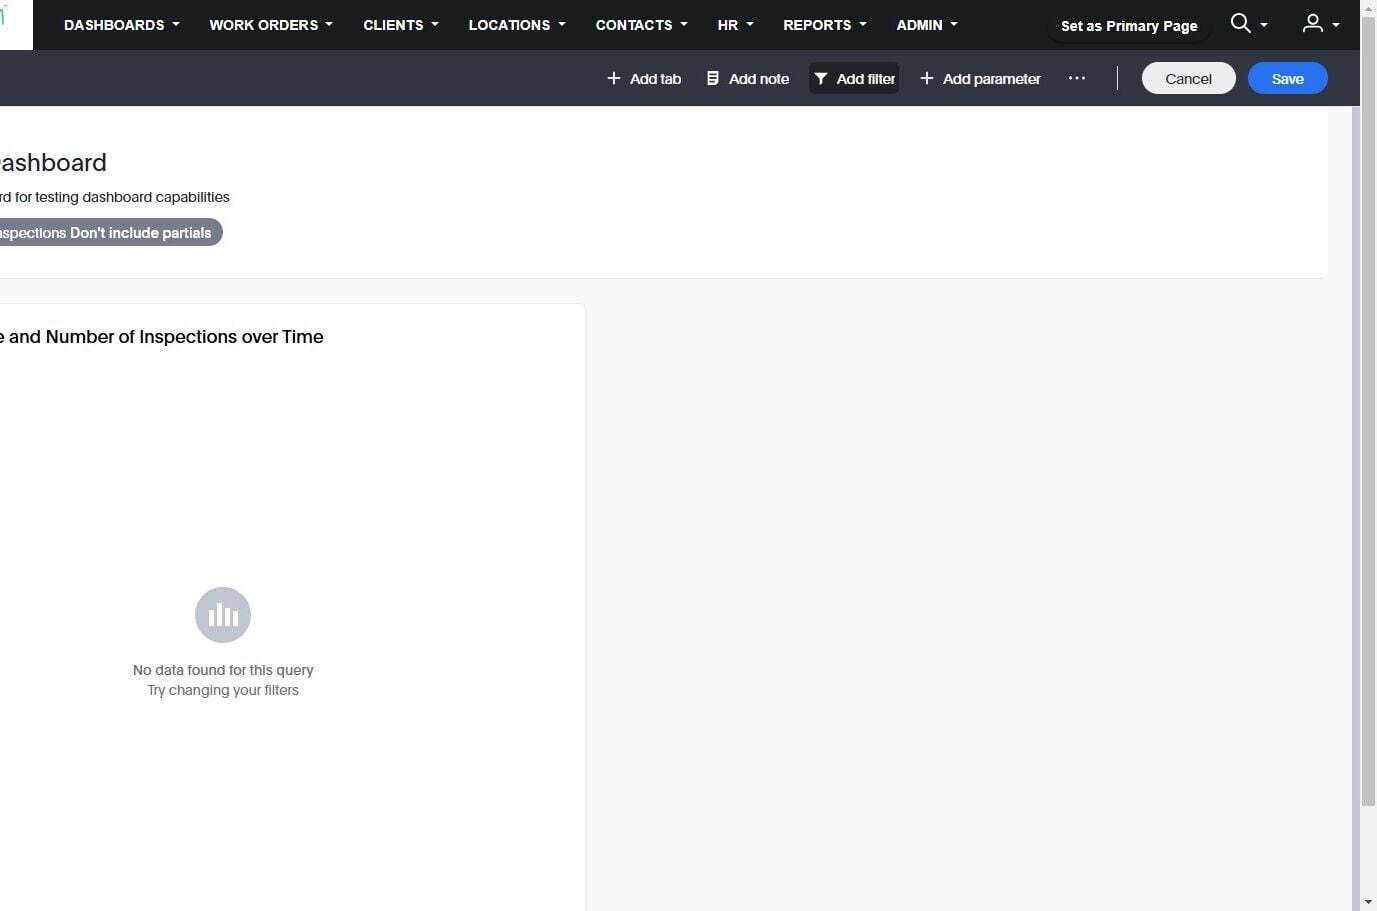
Now you're in edit mode for the dashboard. From here, click "Add filter" at the top of the screen
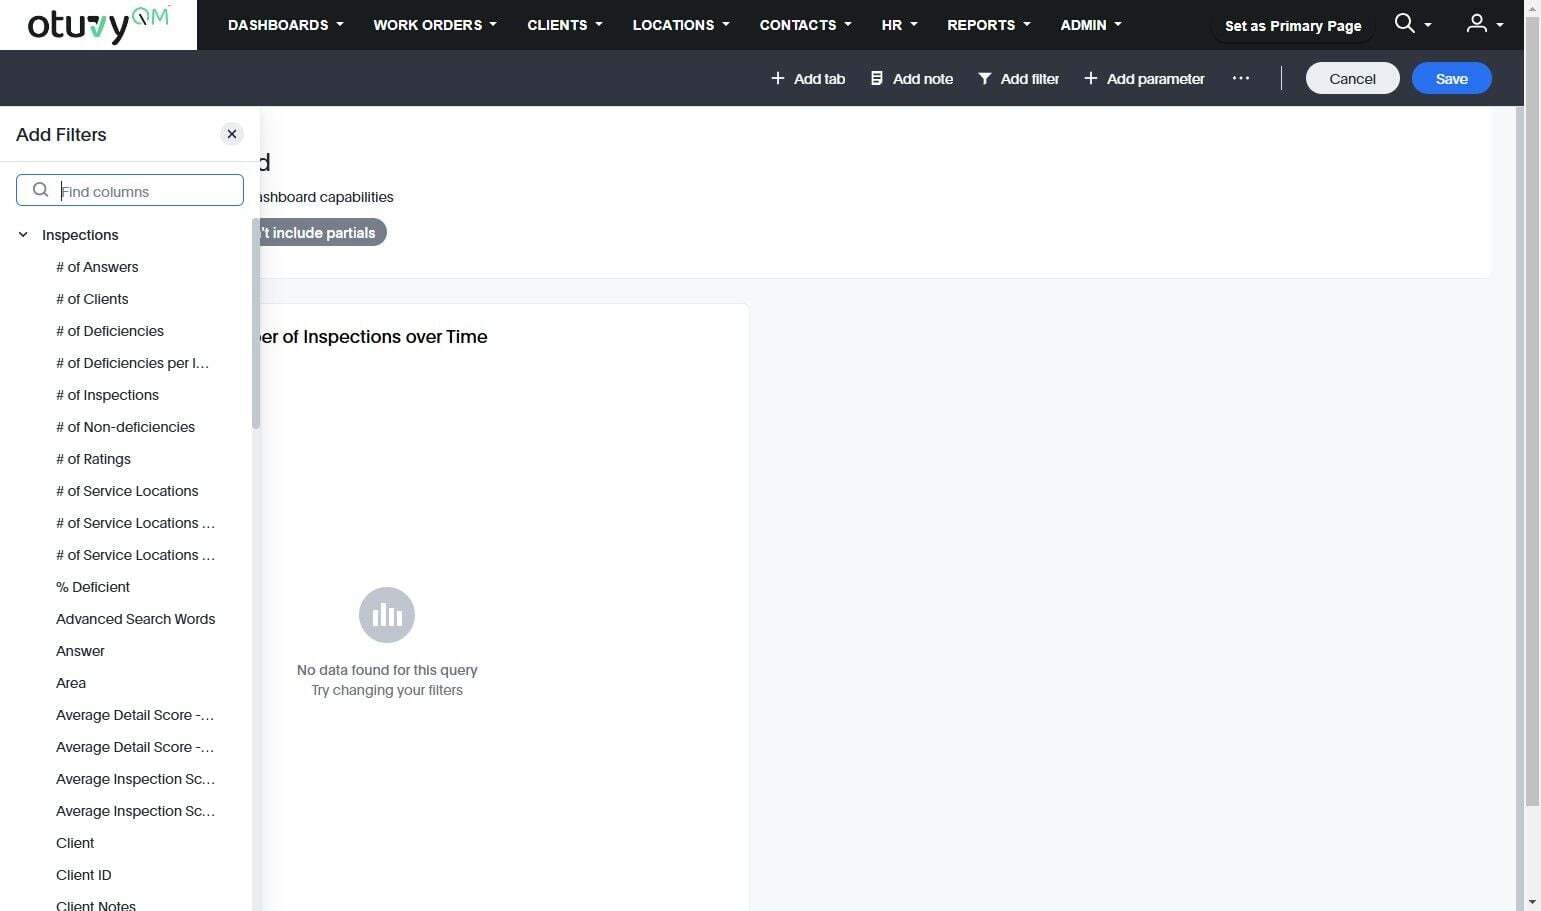
The "Add Filters" panel has opened on the left. You can search or scroll through the filters to add filters to the dashboard. These filters will override any filters in place on the dashlet.
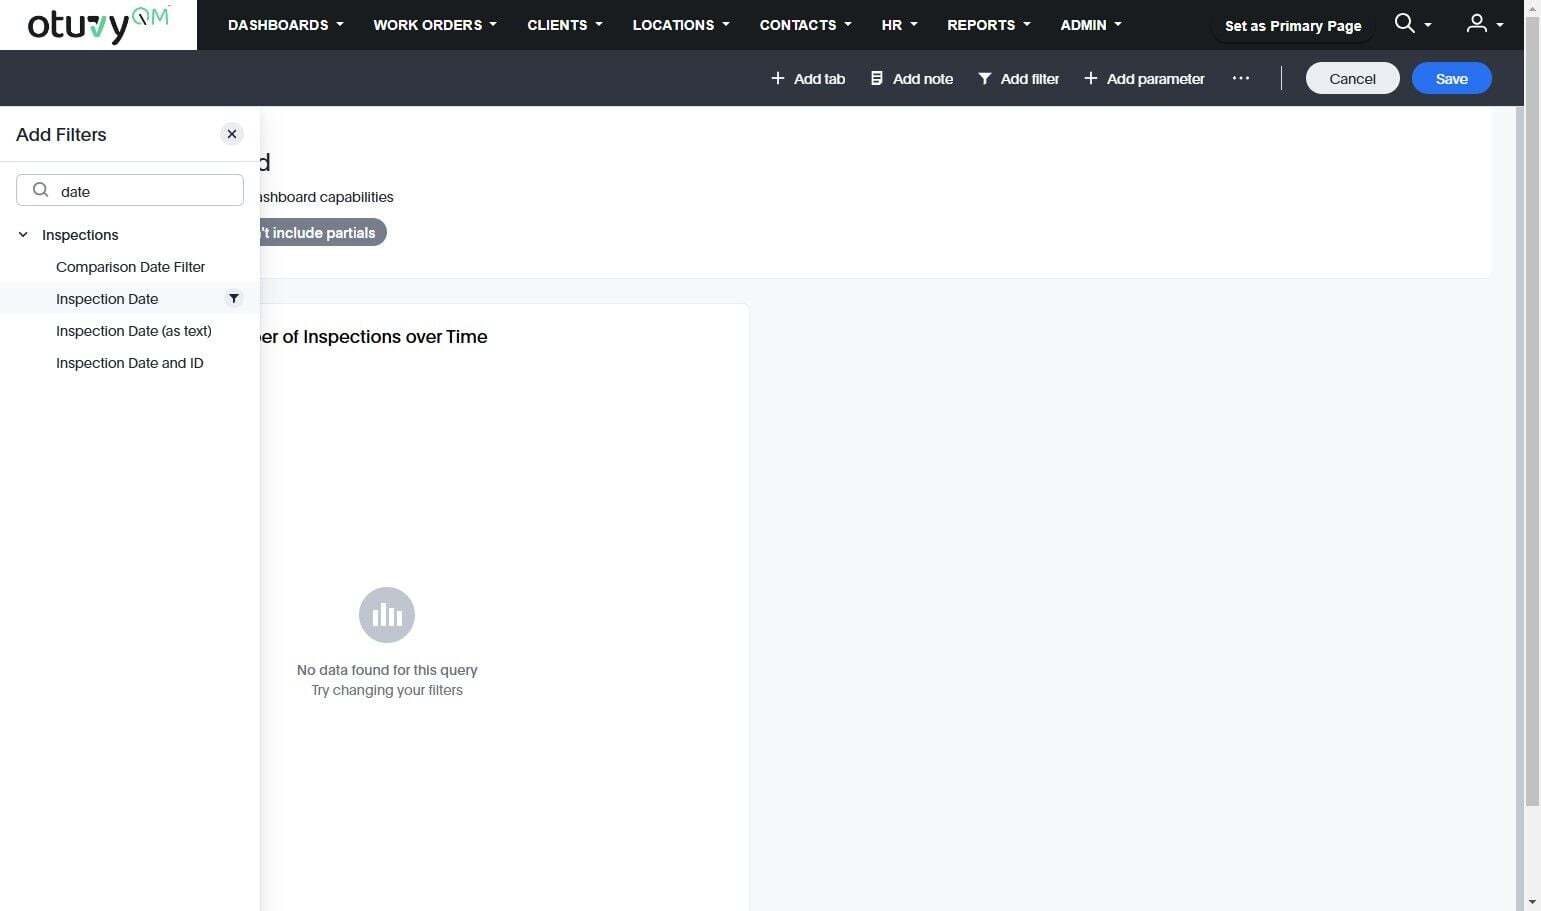
Here we've searched for the word "date" and are going to click "Inspection Date" to add that filter to the dashboard
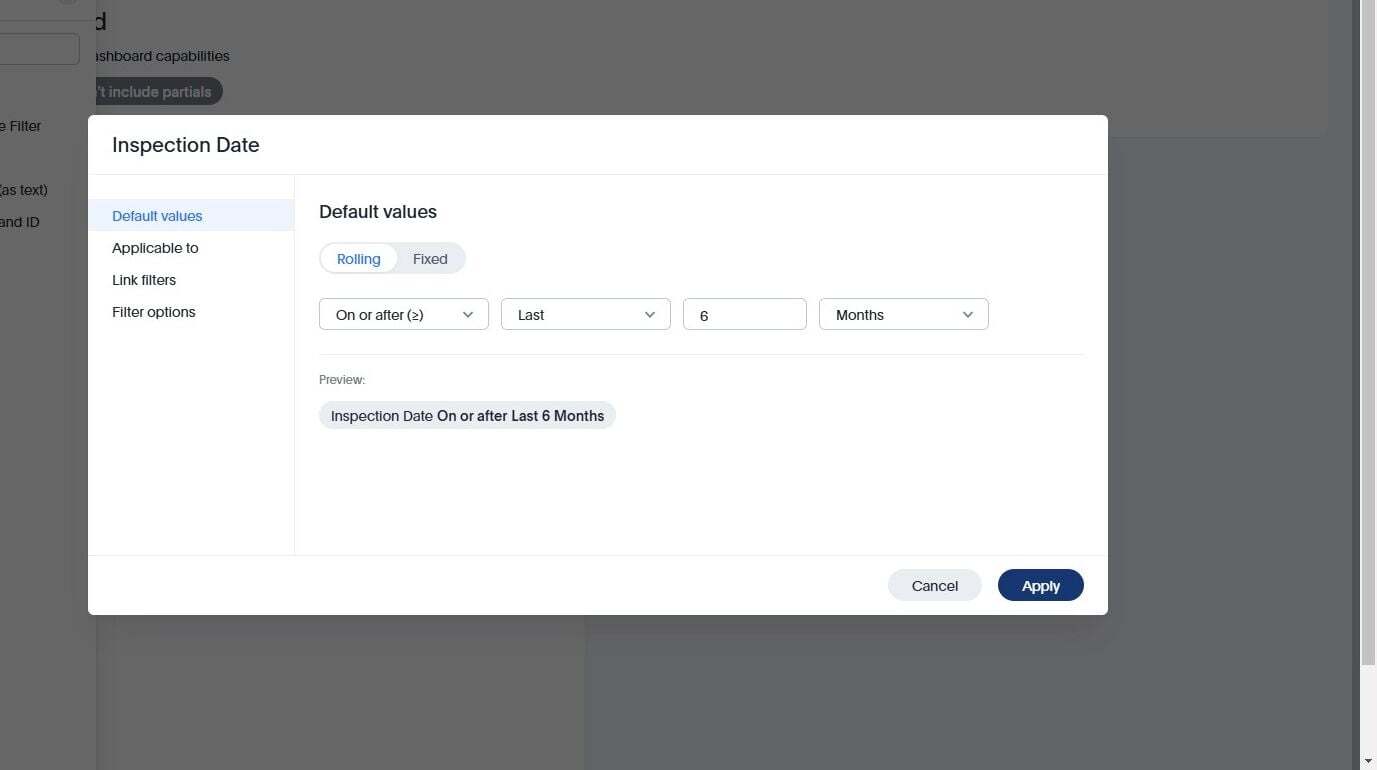
There are two types of date ranges, Rolling and Fixed. In this example, we'll click "Rolling"
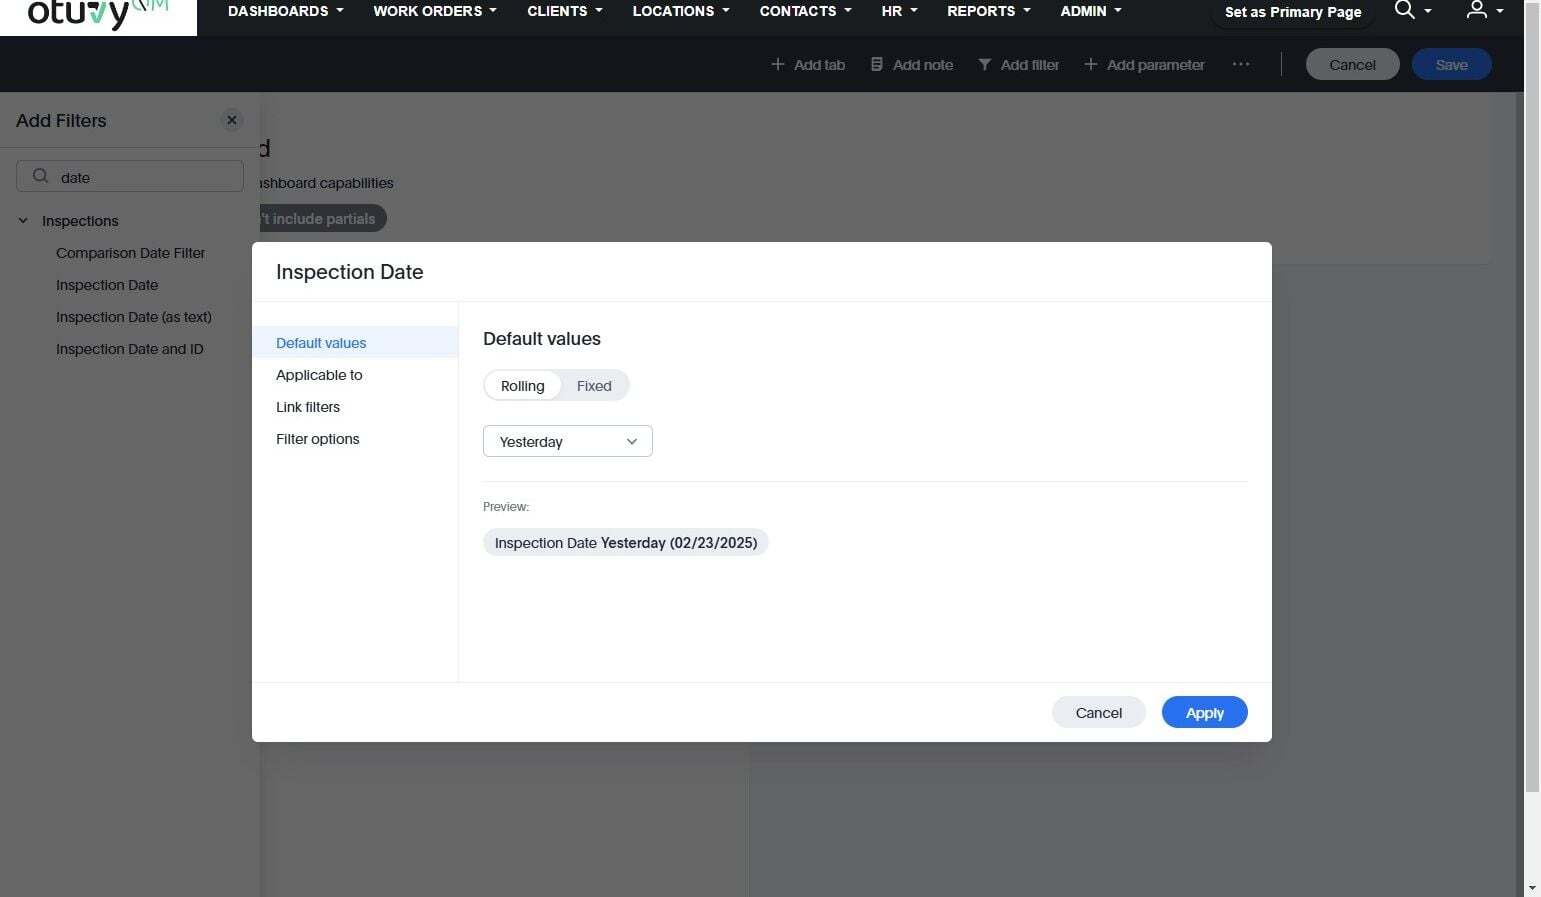
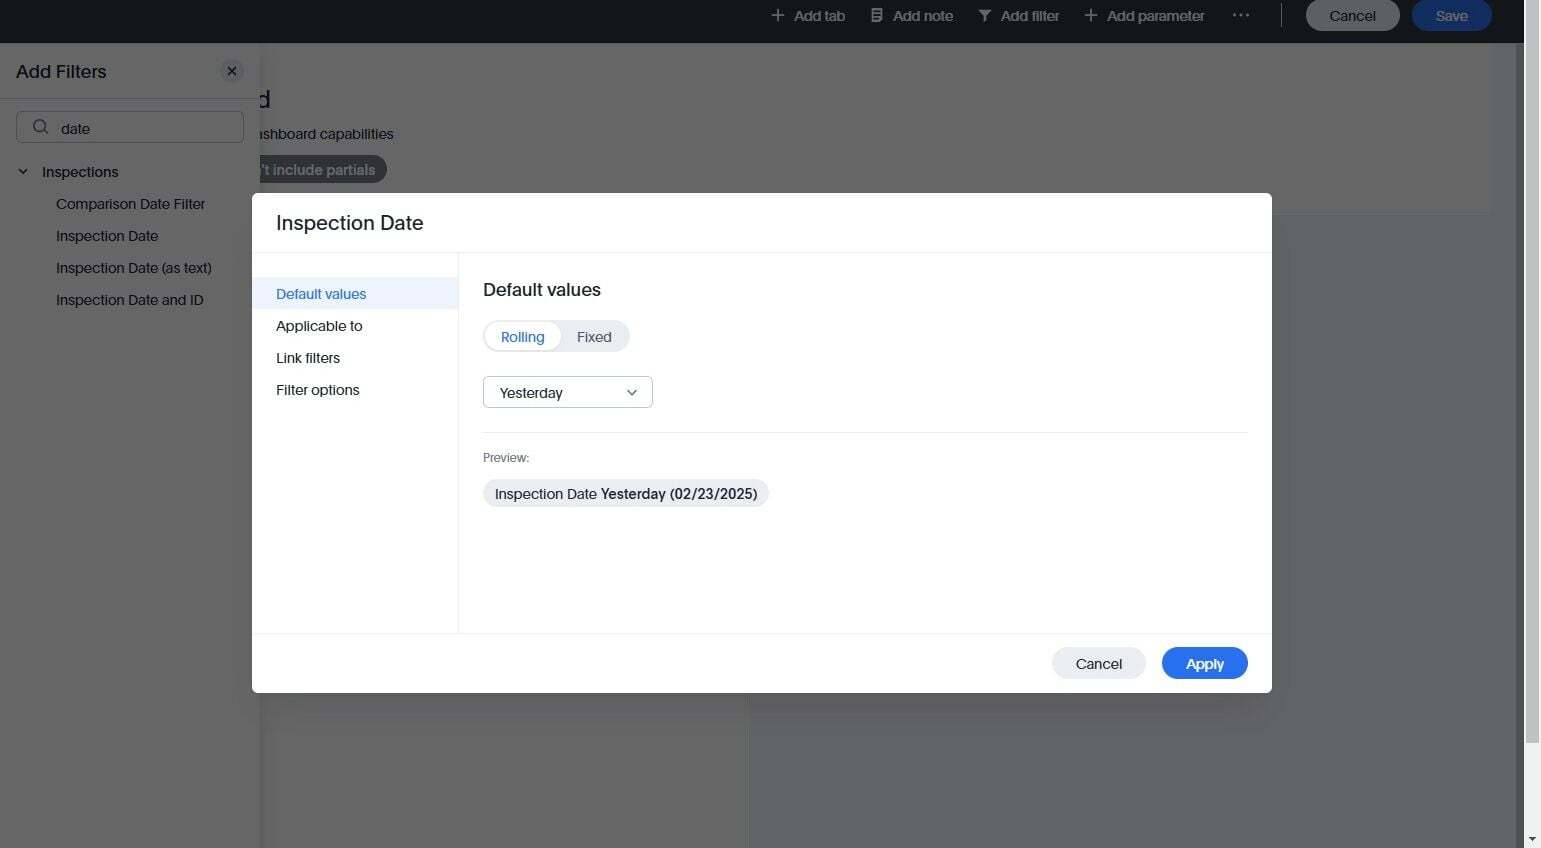
Lets select a greater date range than just yesterday
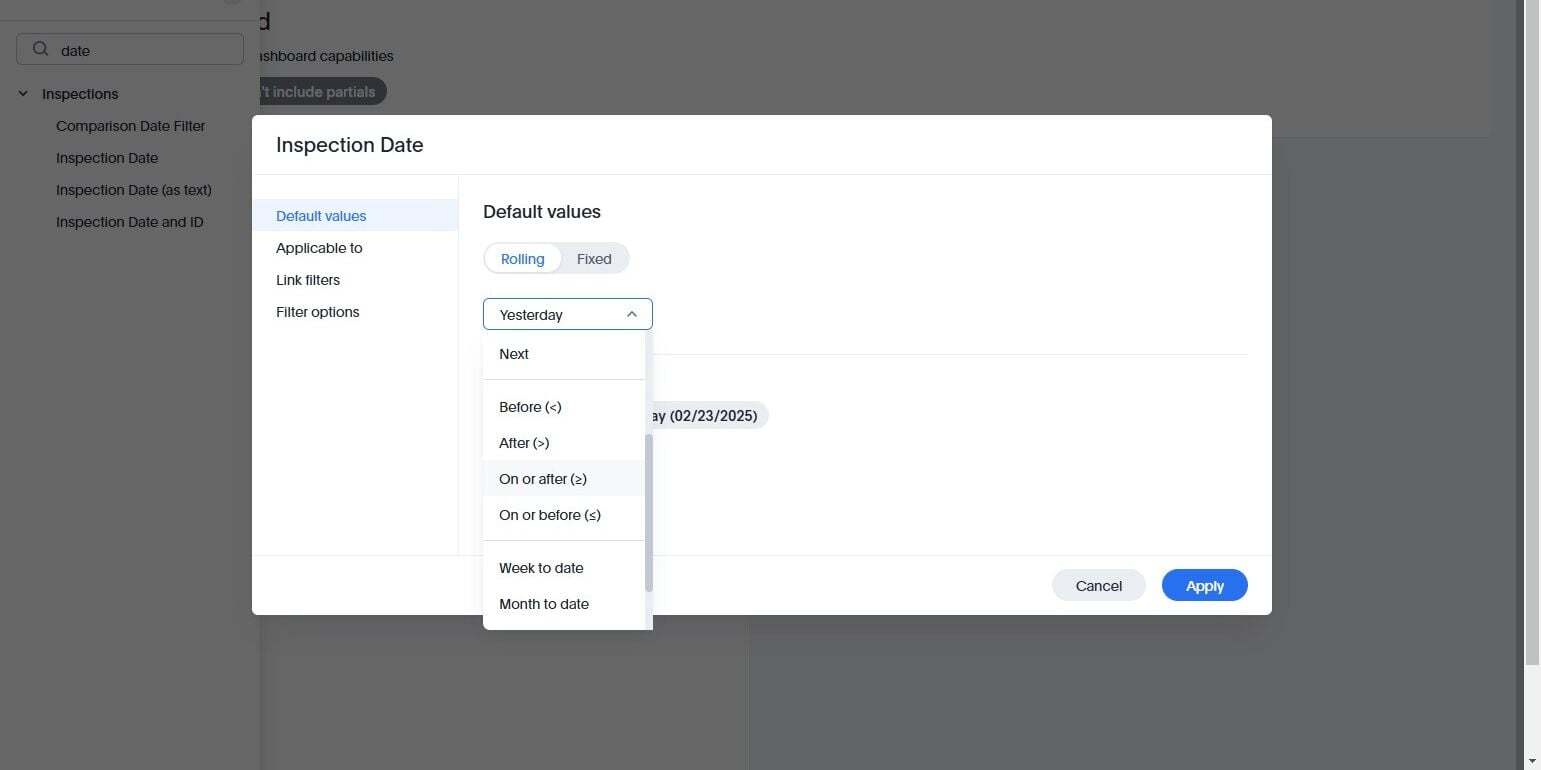
Click "On or after (≥)"
There are more options you can choose from besides This Month, This Year, etc. In this example, we want to include everything from the last 6 months and this month. Select the middle drop-down menu to see what's available.
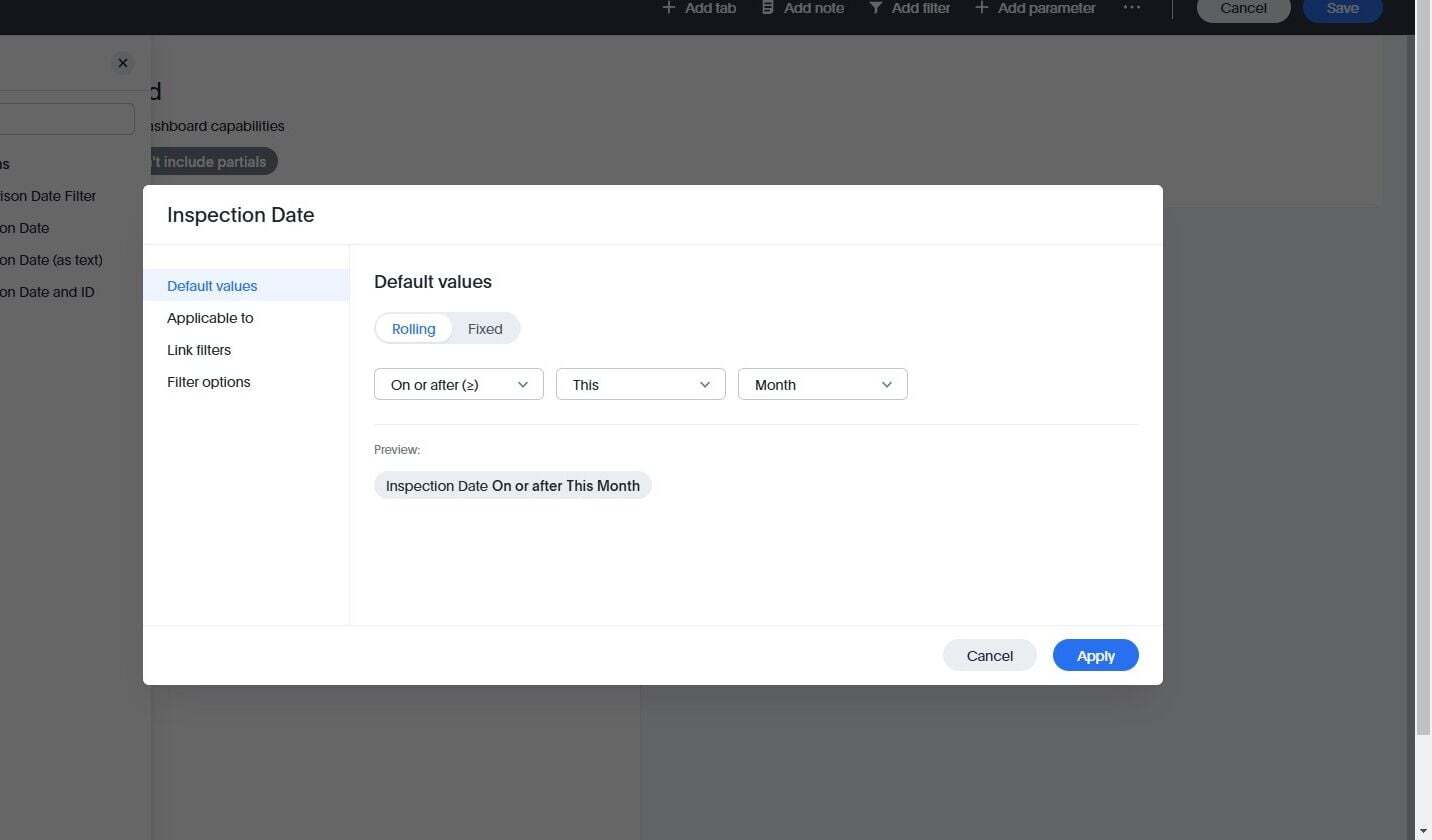
We're going to select "Last" because in the rolling date range we want to see things from the last 6 months
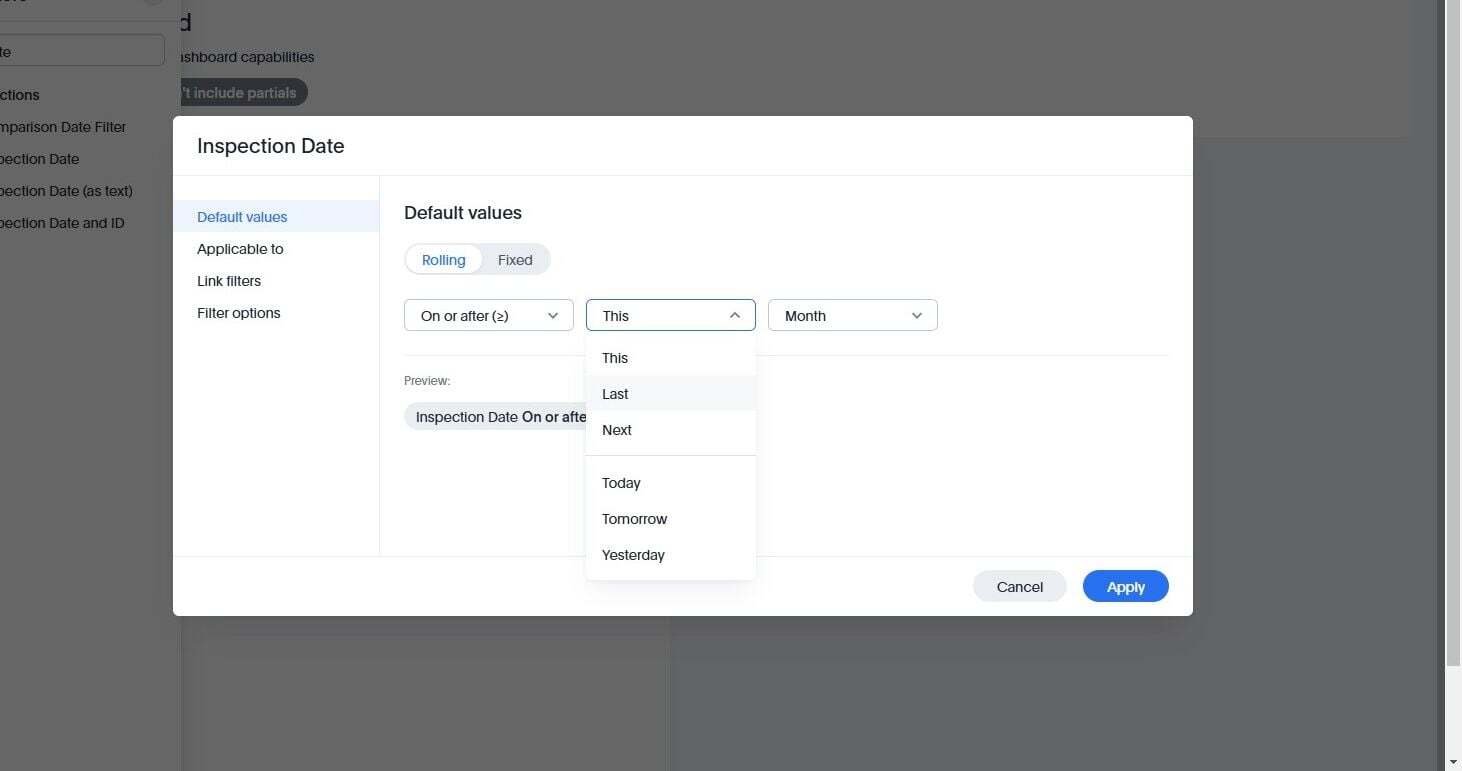
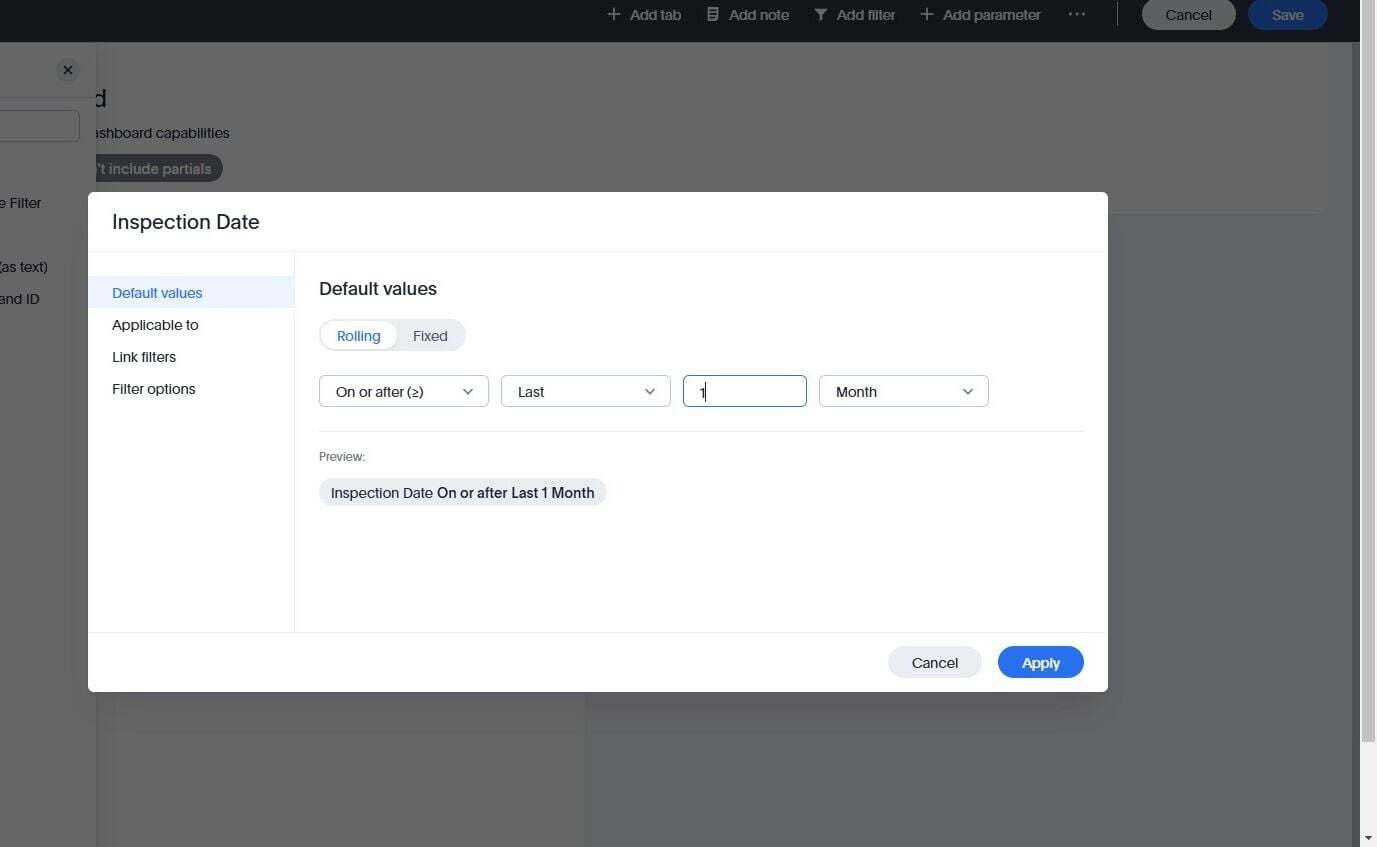
In this text field enter the number 6
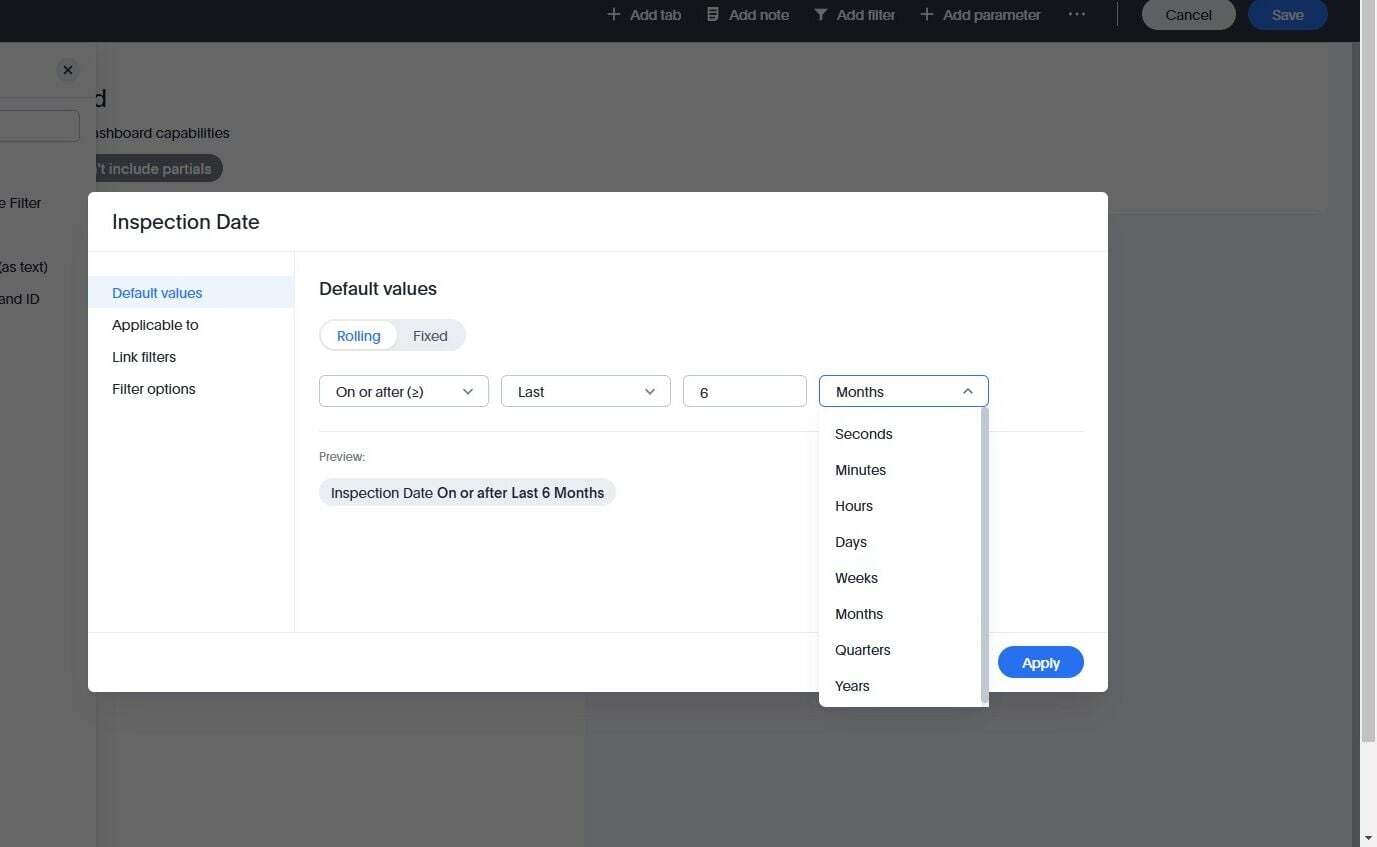
Click "Months" to see the date segments available.
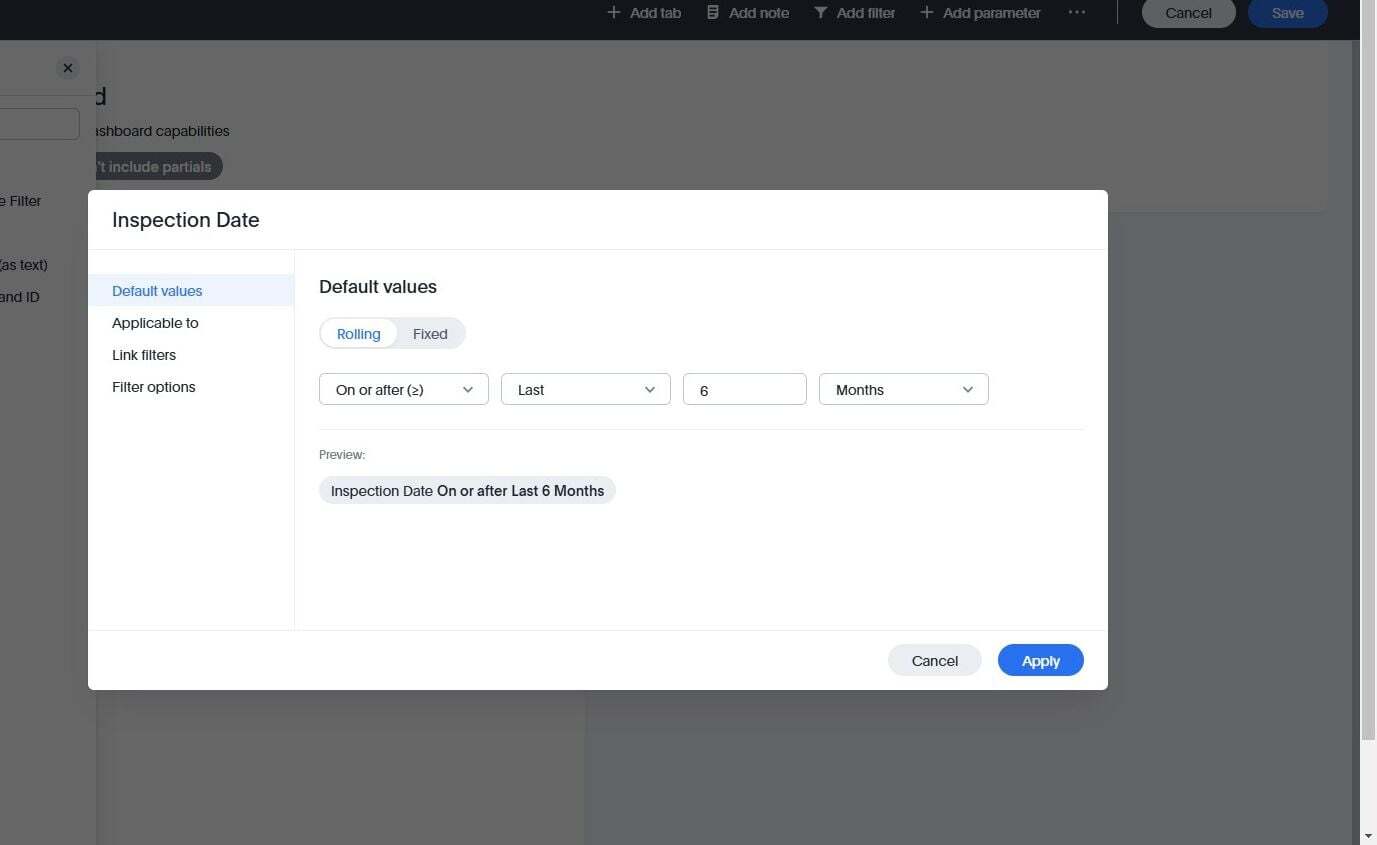
We want Months but you can select days, weeks, quarters, years, etc. To follow along, leave it set to "Months"
Click "Apply"
We can add more filters as well by searching through these options. In this example we will add Client, Service Location, and Inspector. We'll be searching for each of them in turn.
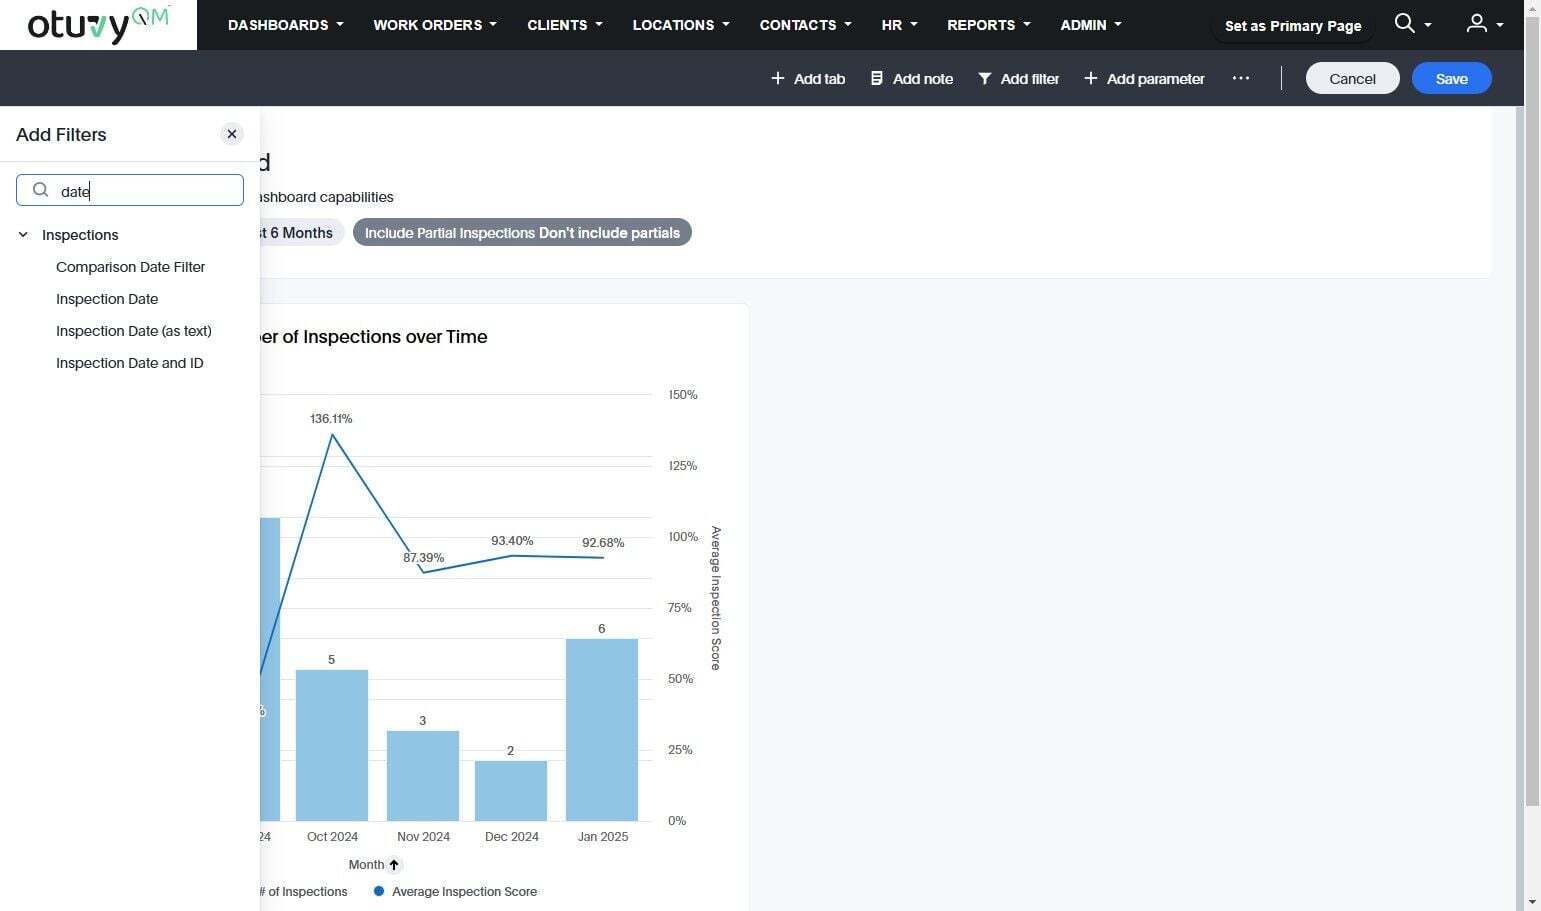
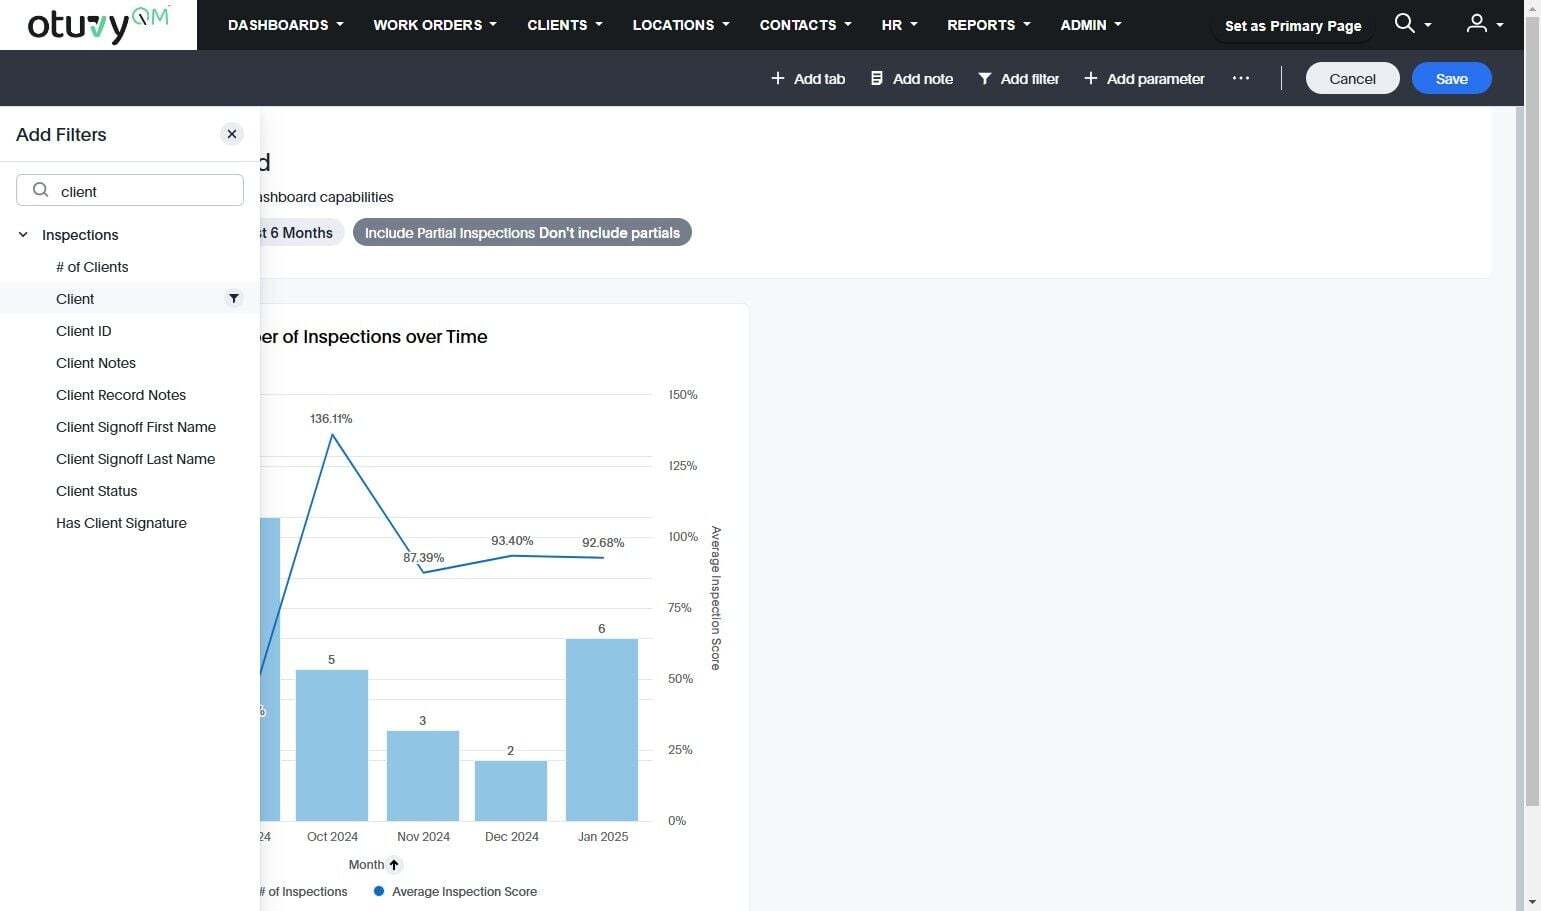
Here is "Client" meaning the Client Name
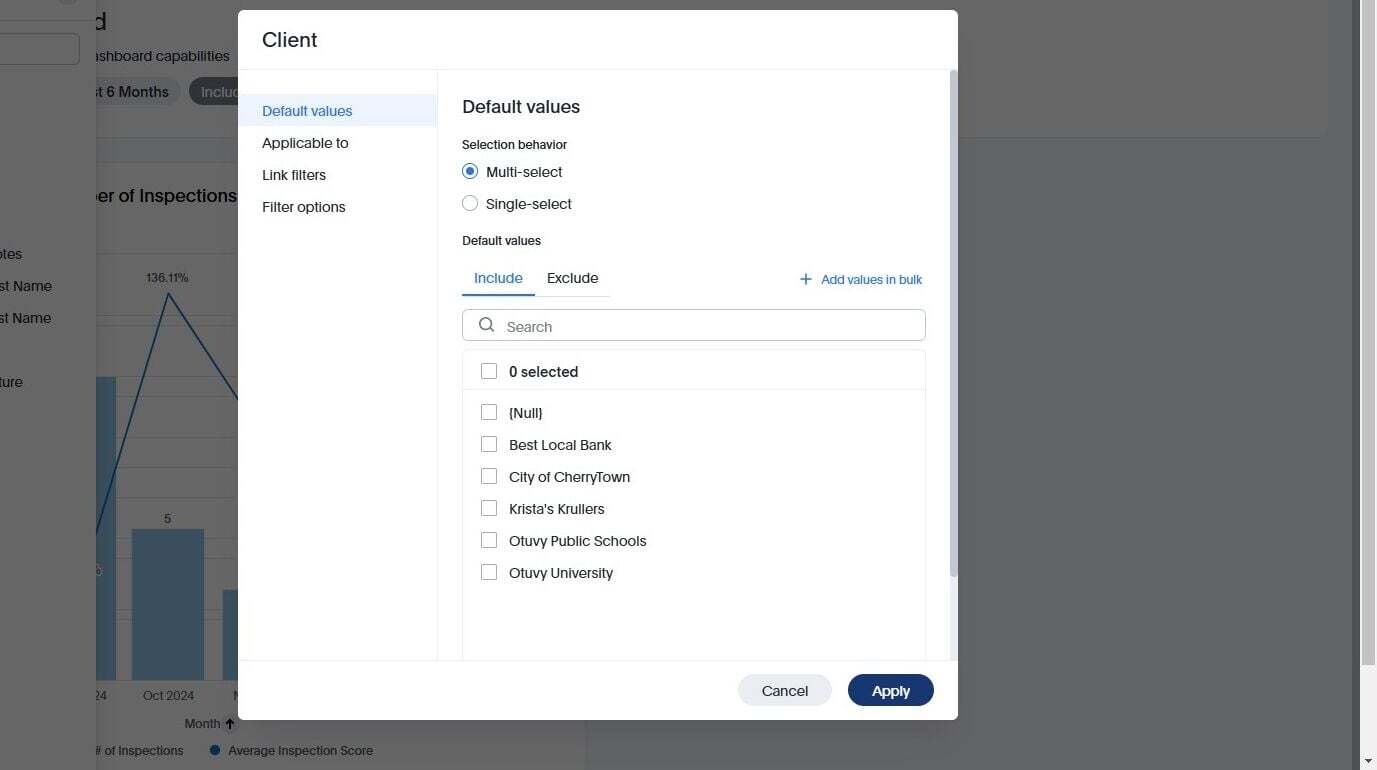
Determine any desired presets and click "Apply." Selecting no values will keep it unfiltered by default
Here is the "Service Location" filter.
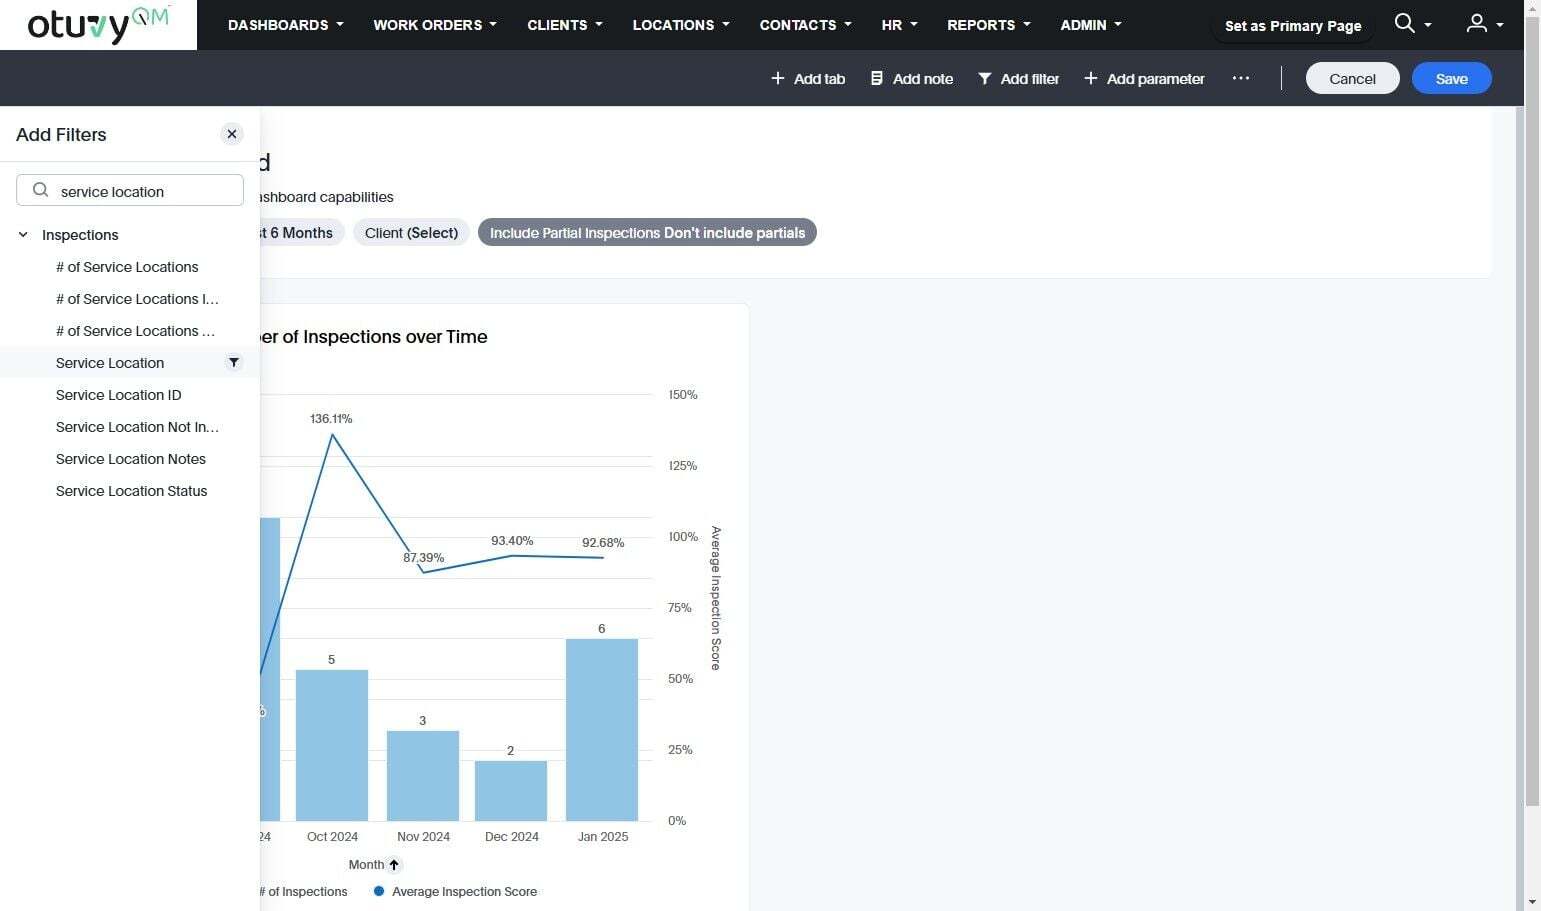
Again, determine any desired presets and click "Apply." Selecting no values will keep it unfiltered by default
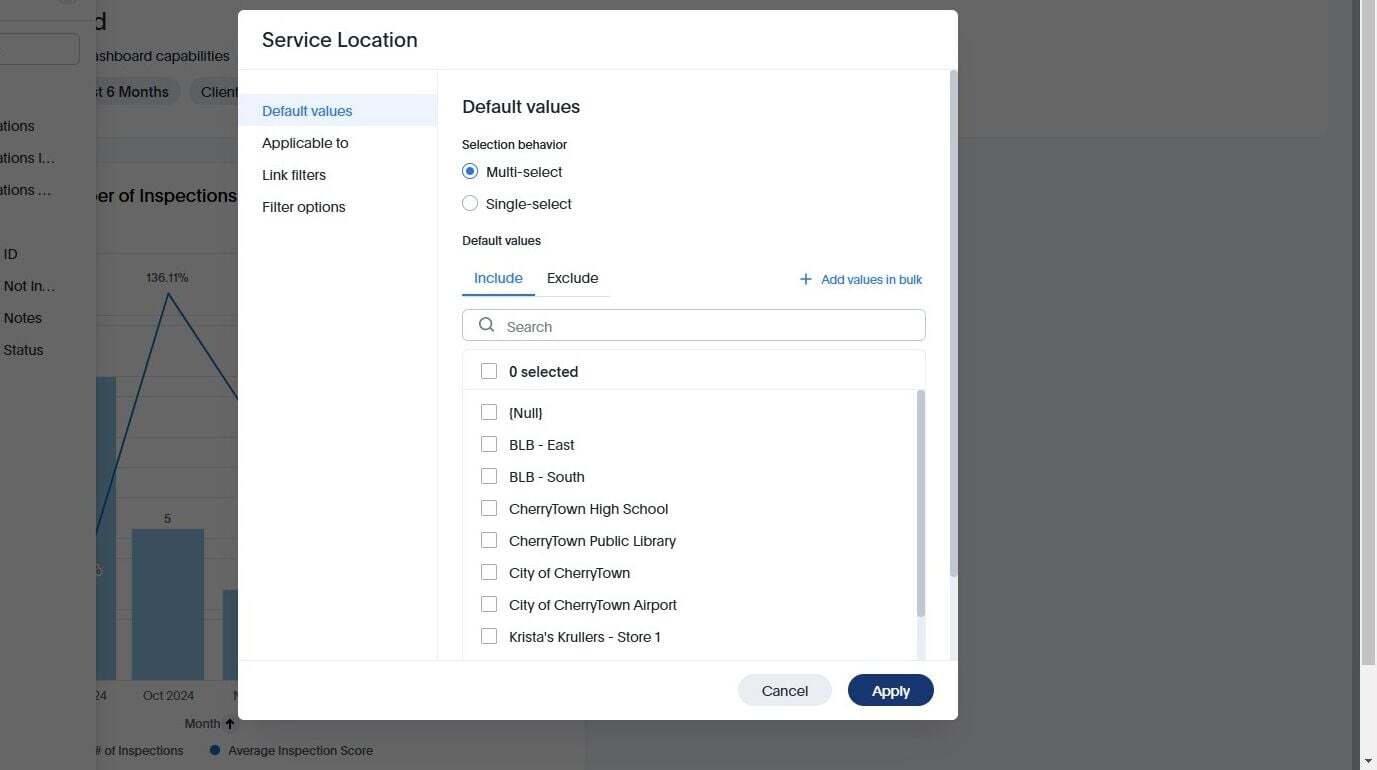
Here is the "Inspector" filter. This is the name of the person who performed the inspection.
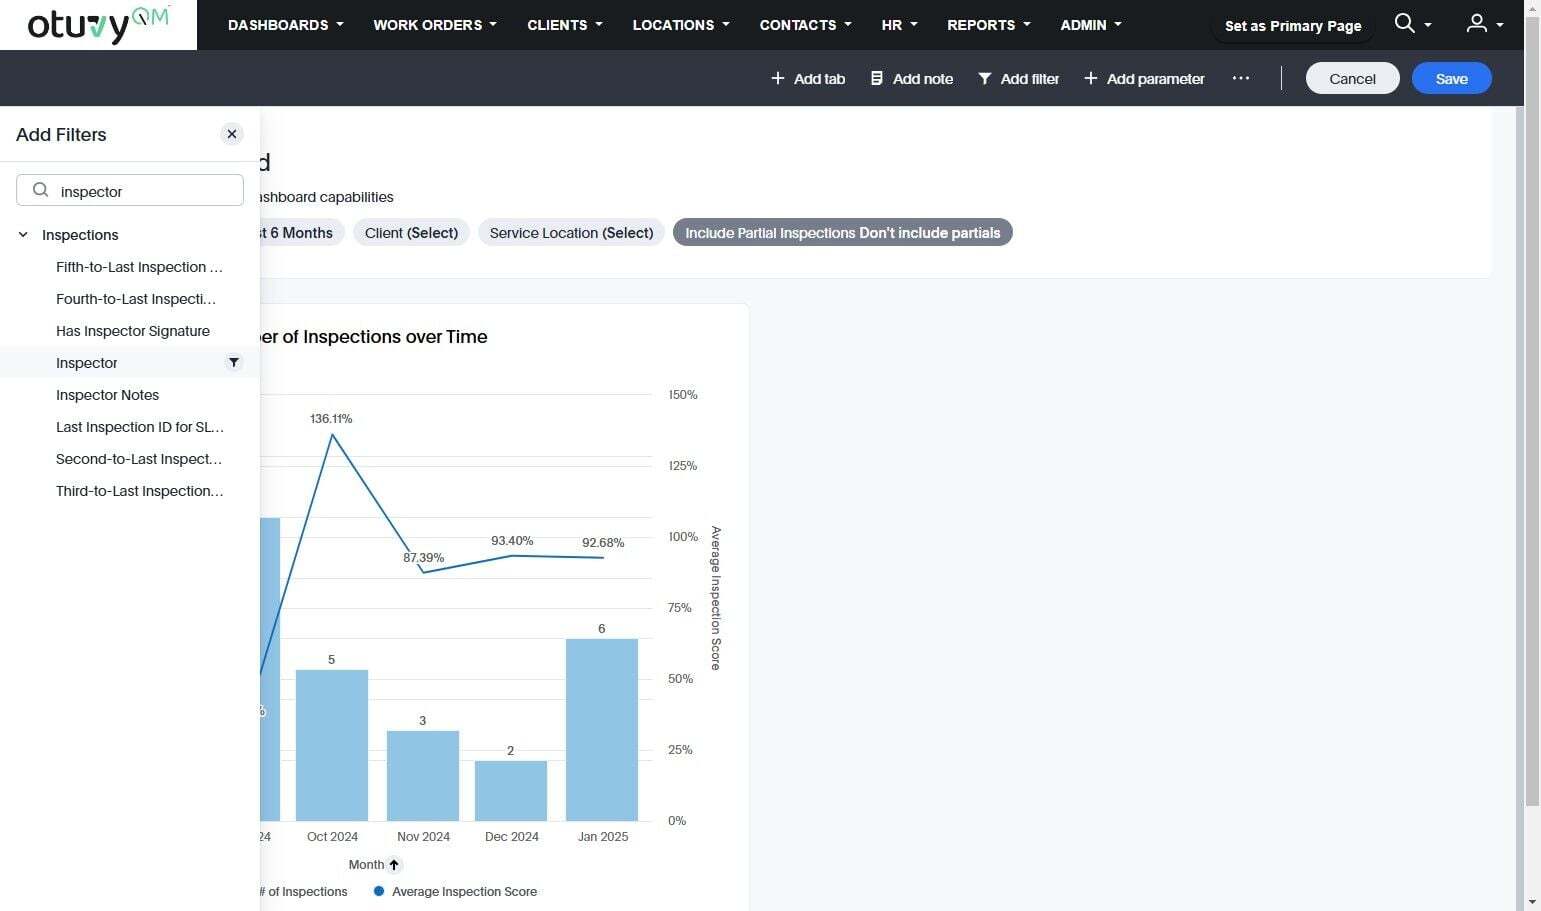
Again, determine any desired presets and click "Apply." Selecting no values will keep it unfiltered by default
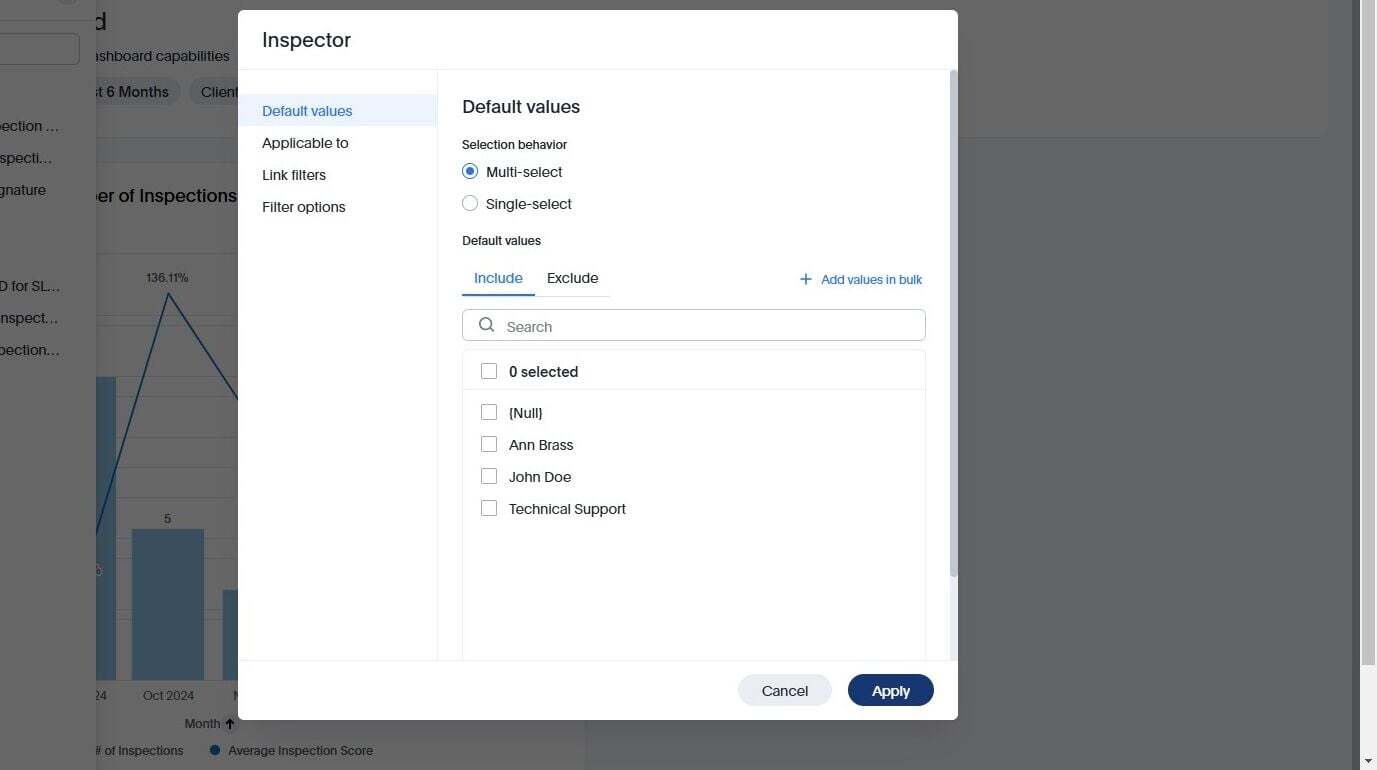
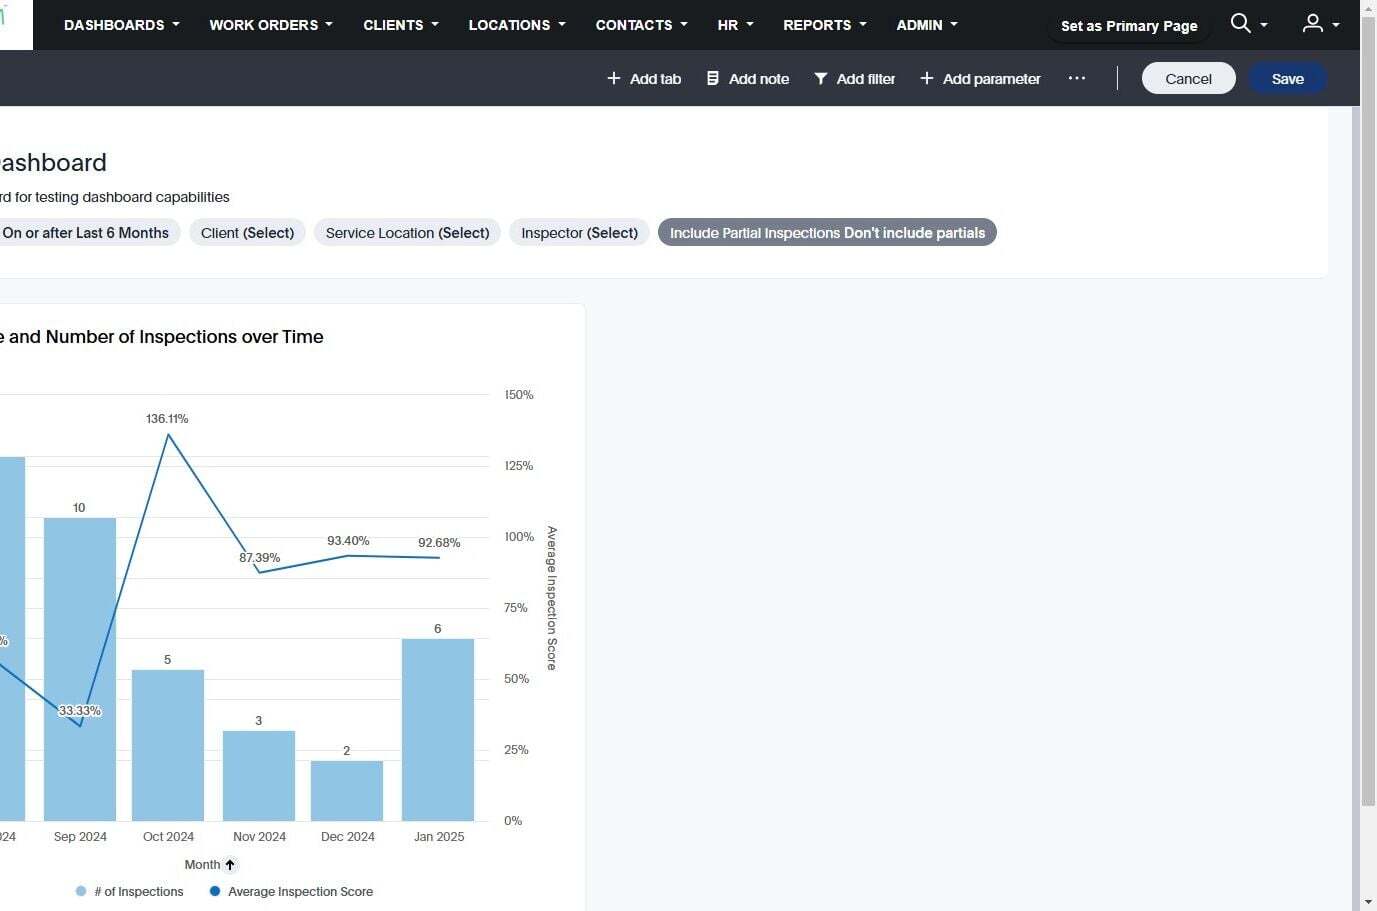
Remember, once you have selected all the filters you want for the dashbaord to click "Save"
### Create a Dashlet
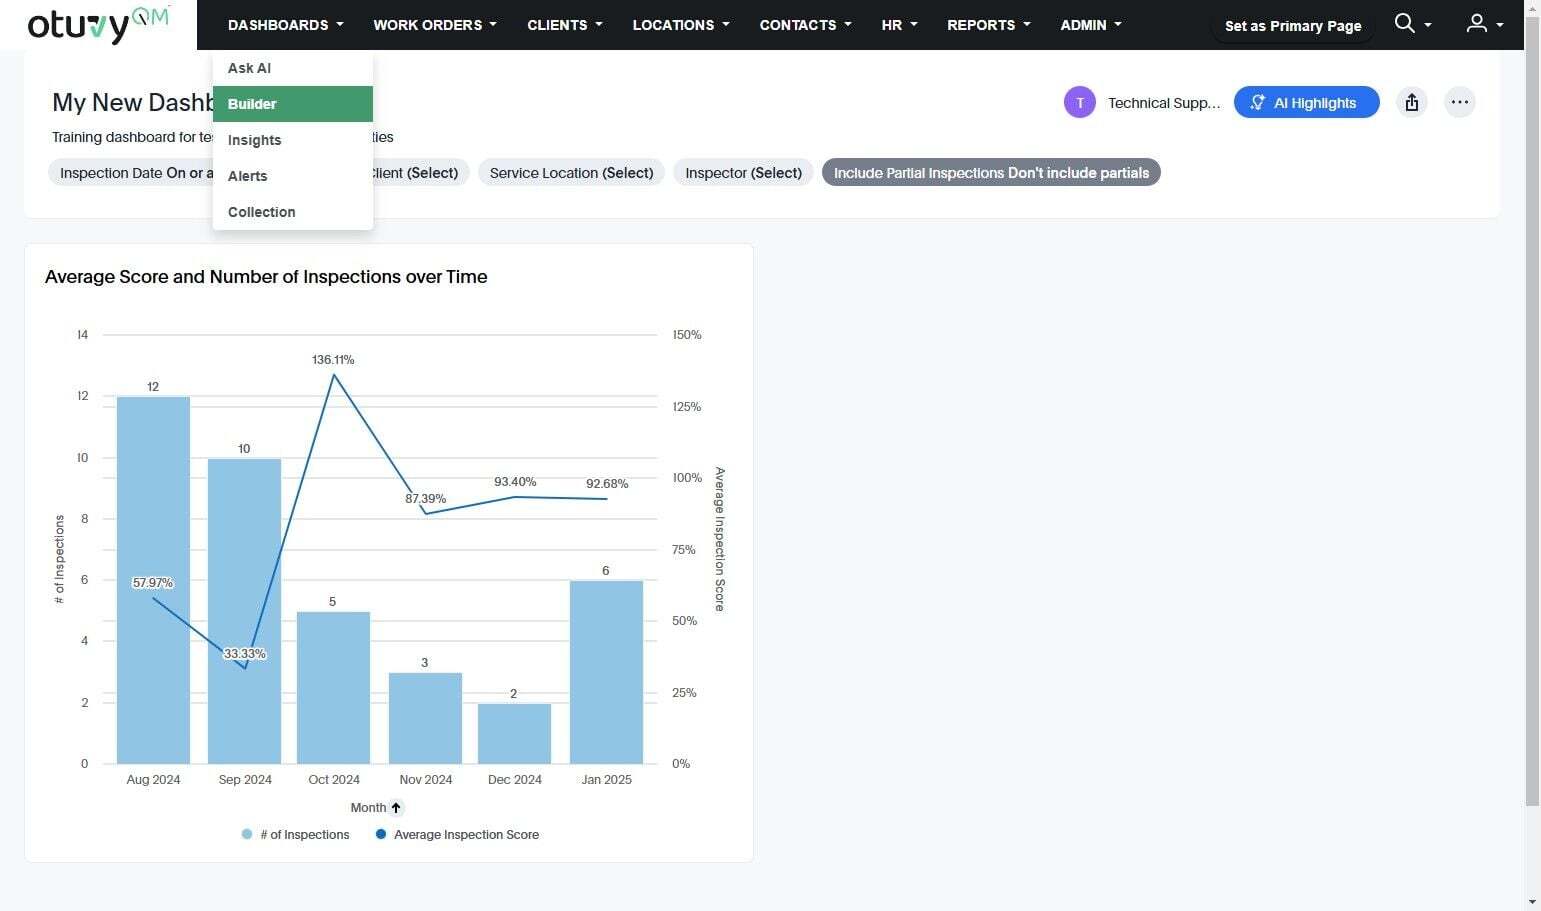
In addition to pinning existing dashlets to your dashboard you can create brand new dashlets for your dashboards. Pull up our dashlet builder tool by hovering over Dashboards in the main navigation and then click "Builder"
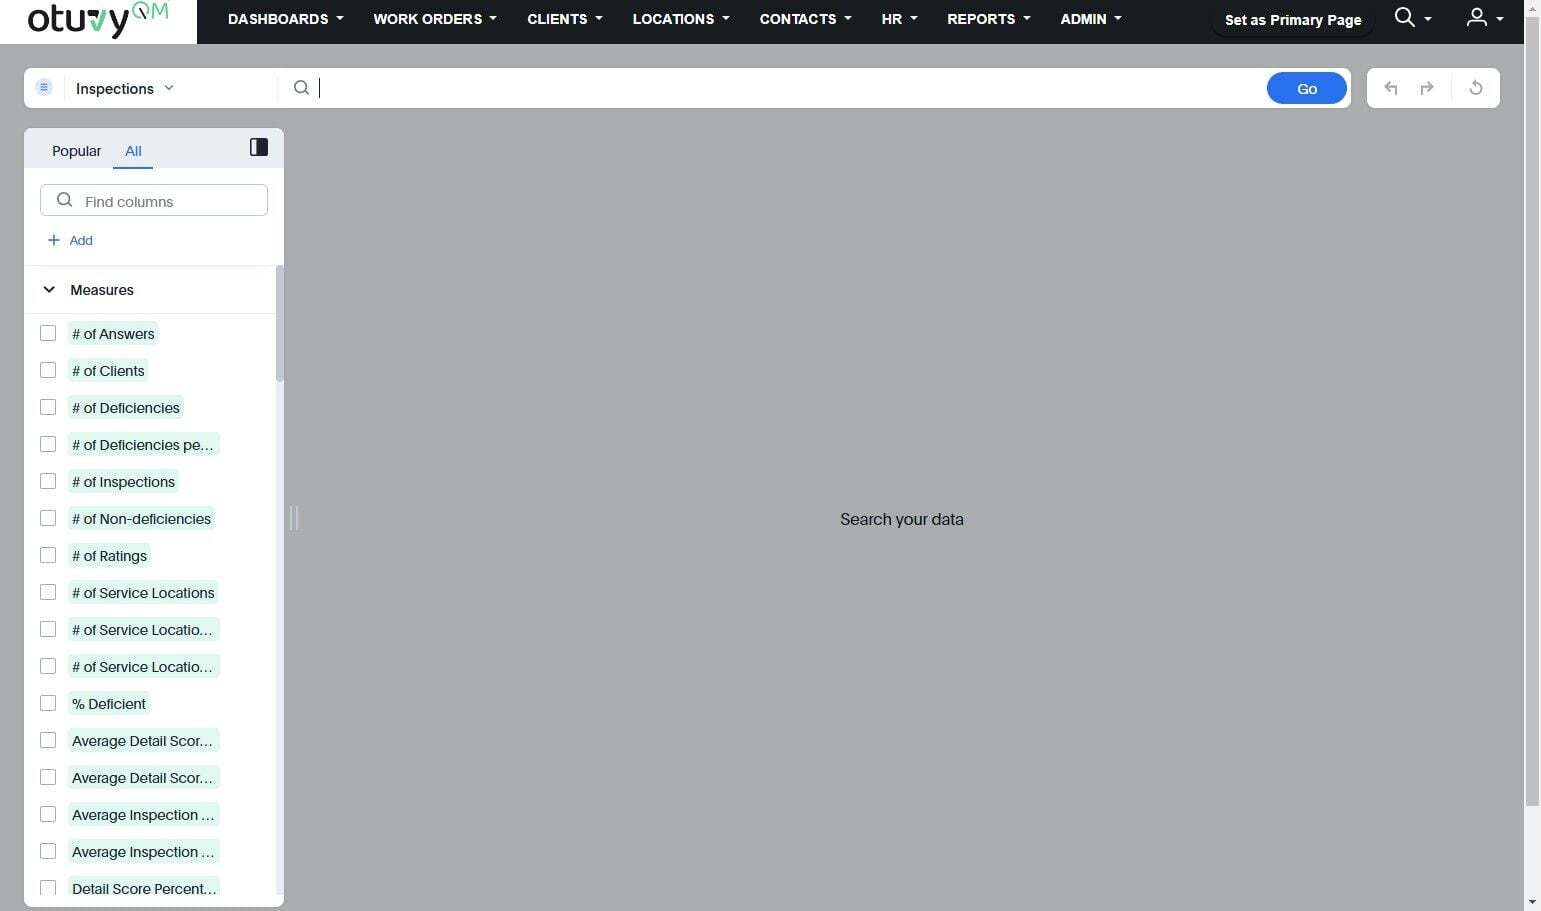
You can add measures and attributes from within the "search box" at the top as well as other filters and parameters. Attributes are text or date values associated with your inspections or work orders and Measures are numeric values you can do math on like your response times, or average inspection scores.
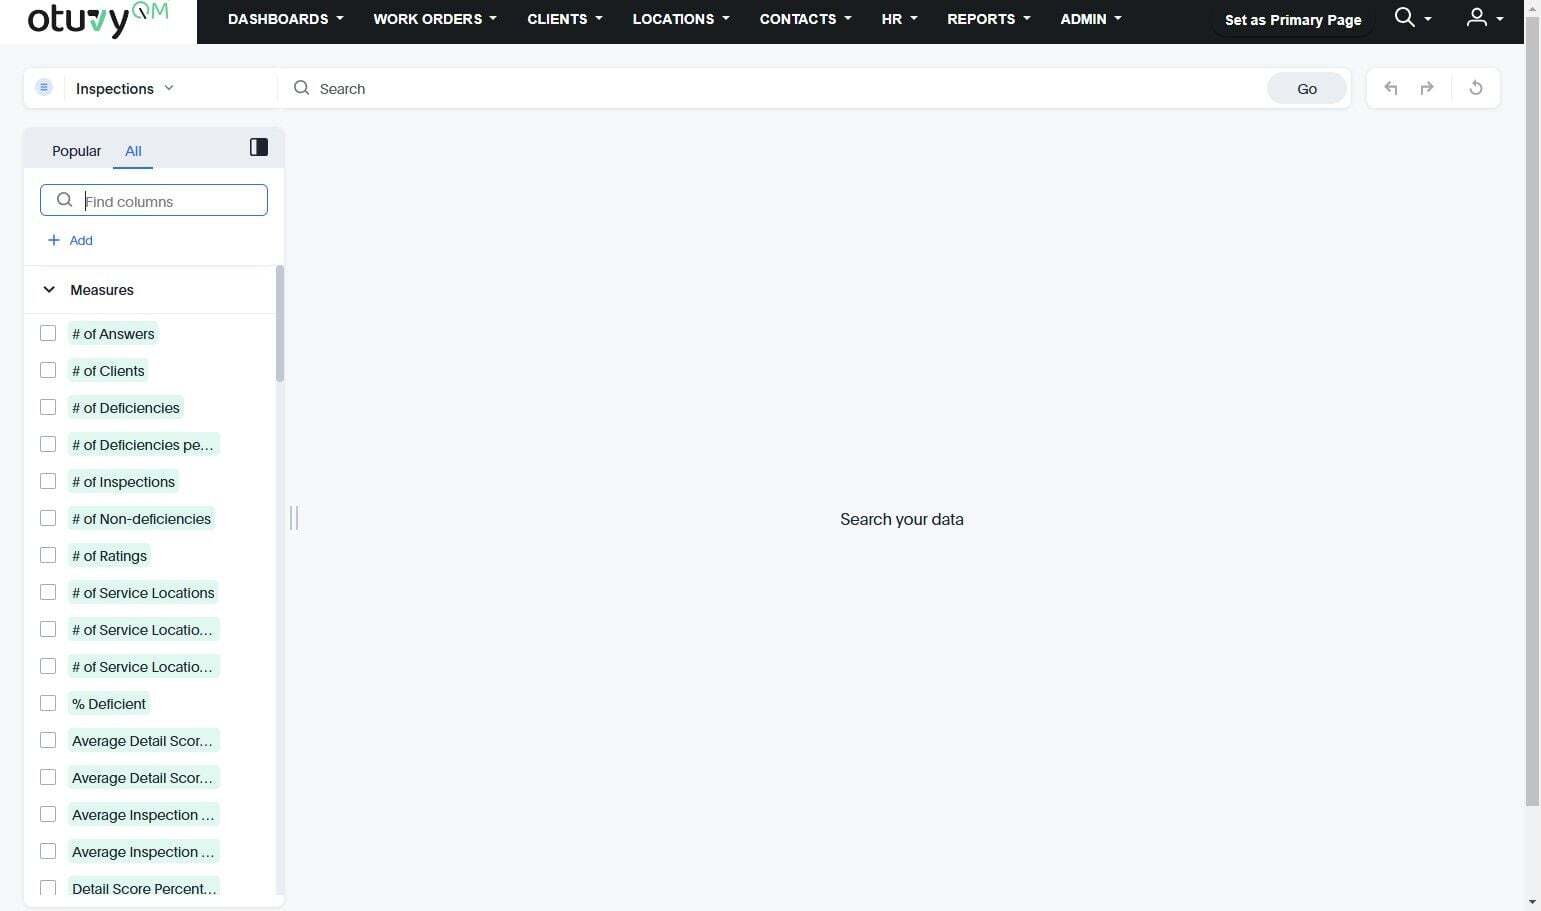
Instead of typing them in at the top, you can search for the pre-defined measures, attributes, and dates using the "Find columns" field.
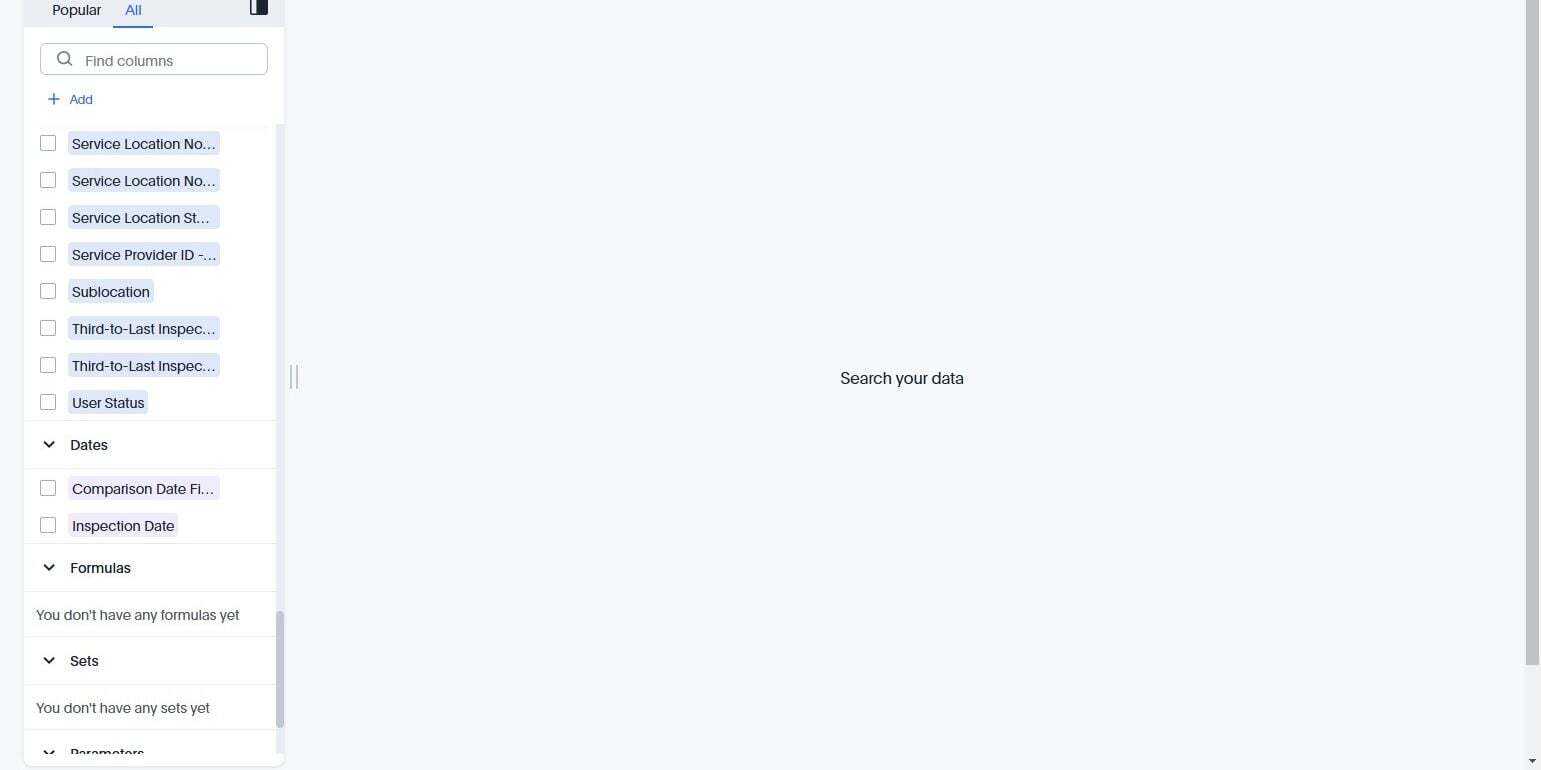
Or scroll through and select measures, attributes, dates, and functions on the left.
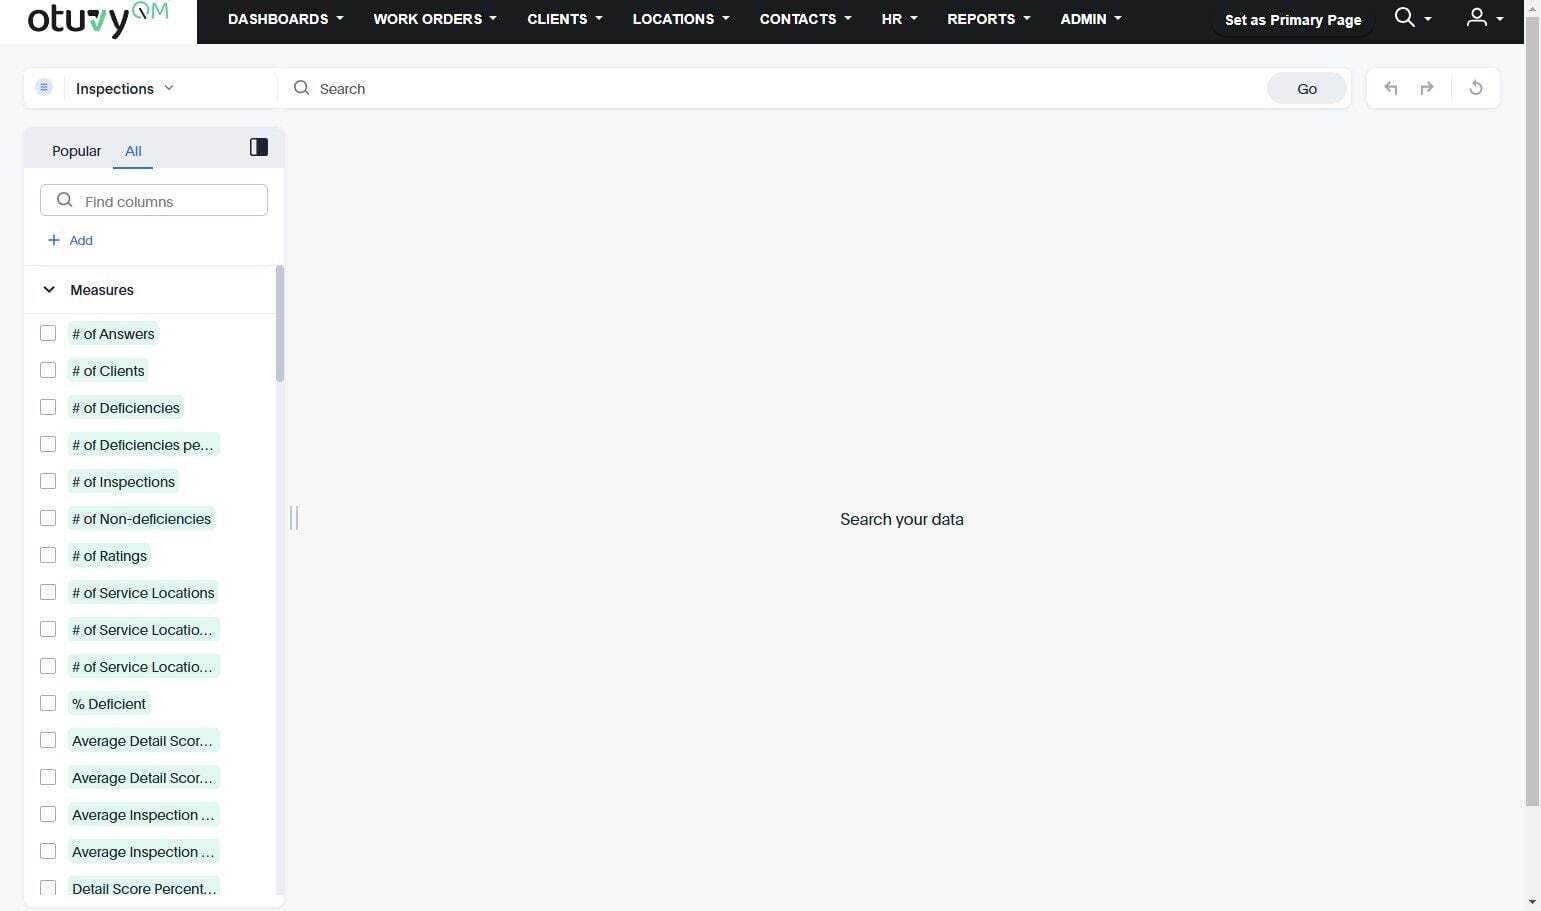
Measures are green, Attributes are blue, and dates are purple.
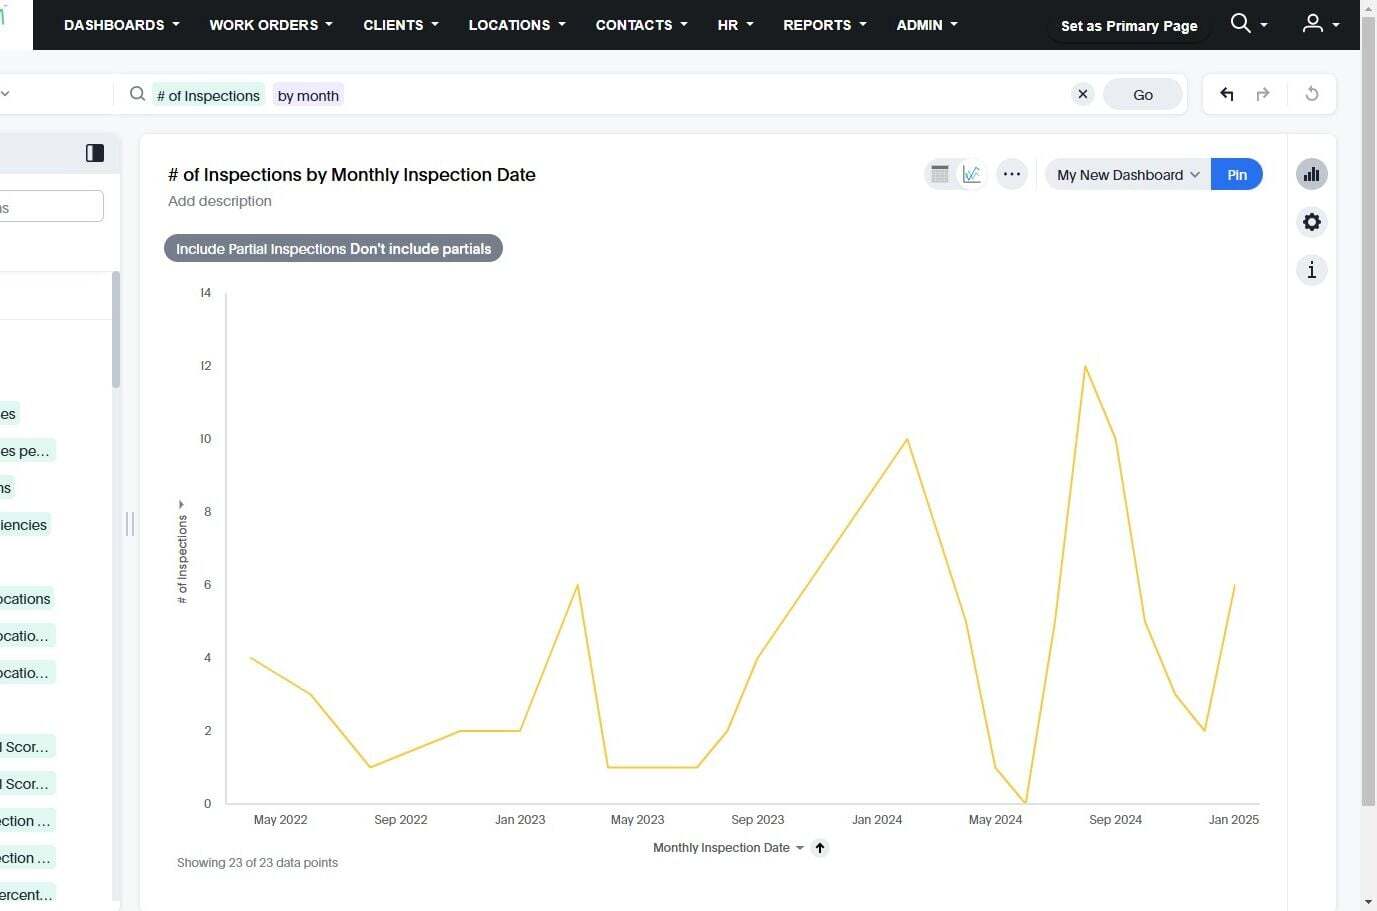
Some keywords you can enter into the search bar, like "by month" require some interpretation from the system. The system lets you know how it is evaluating the statement and asks you to either "Edit" or "Confirm"
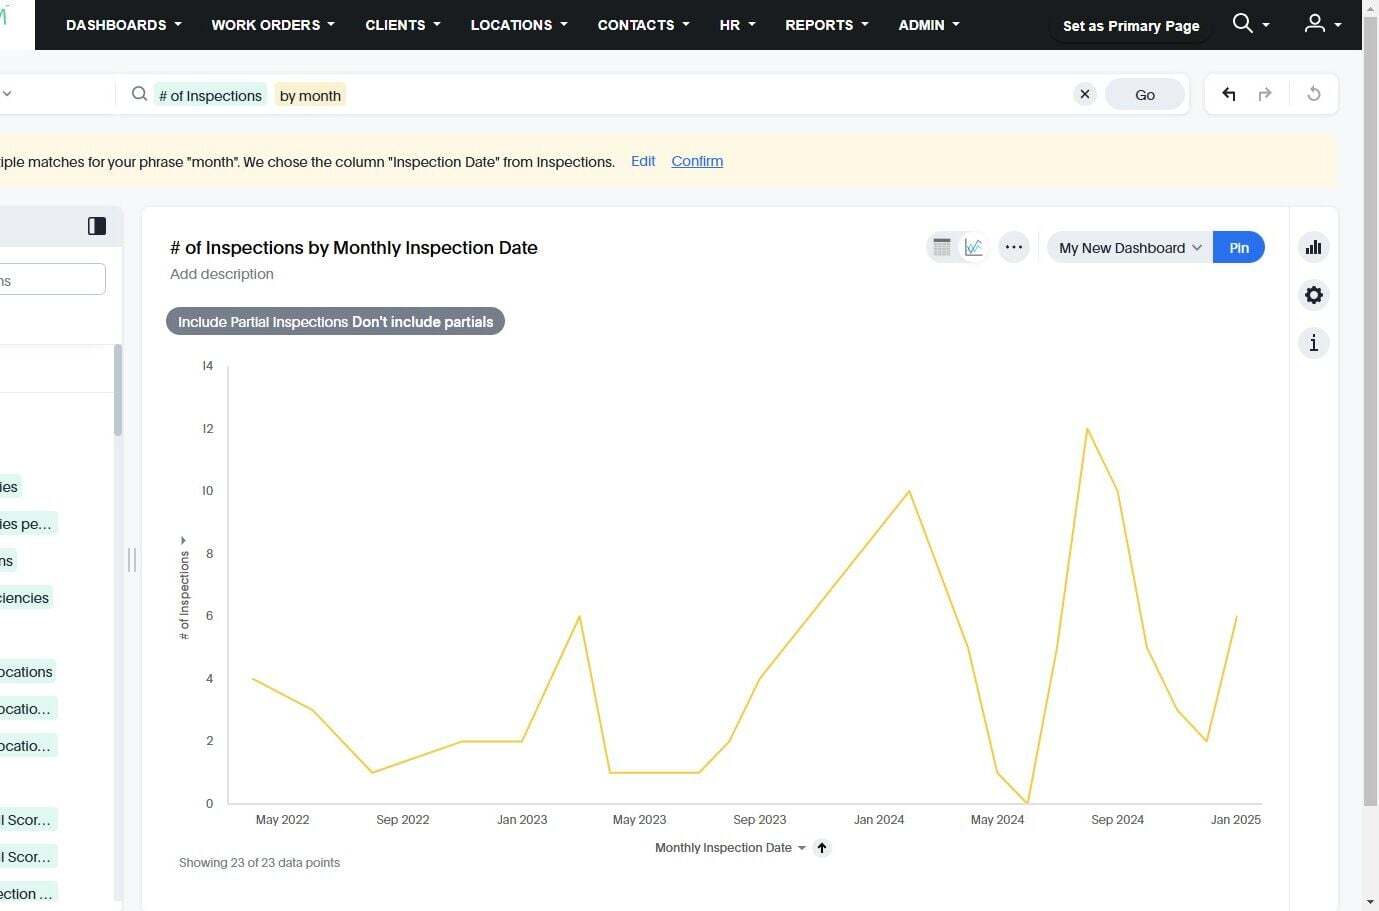
Once things look right, you can pin it to any of your custom dashboards. If you have multiple custom dashboards you can select this drop down to choose from them
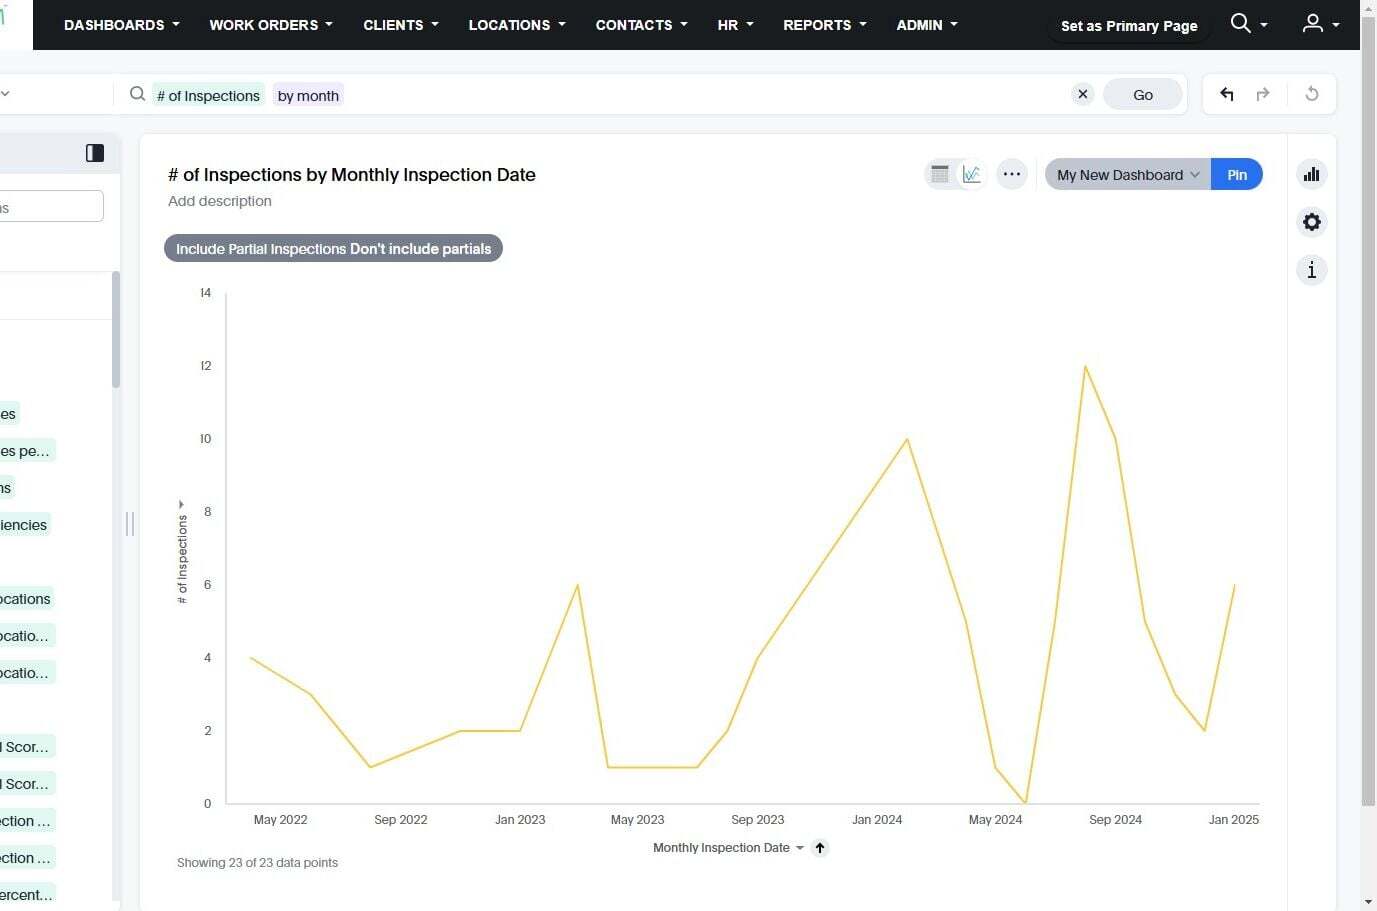
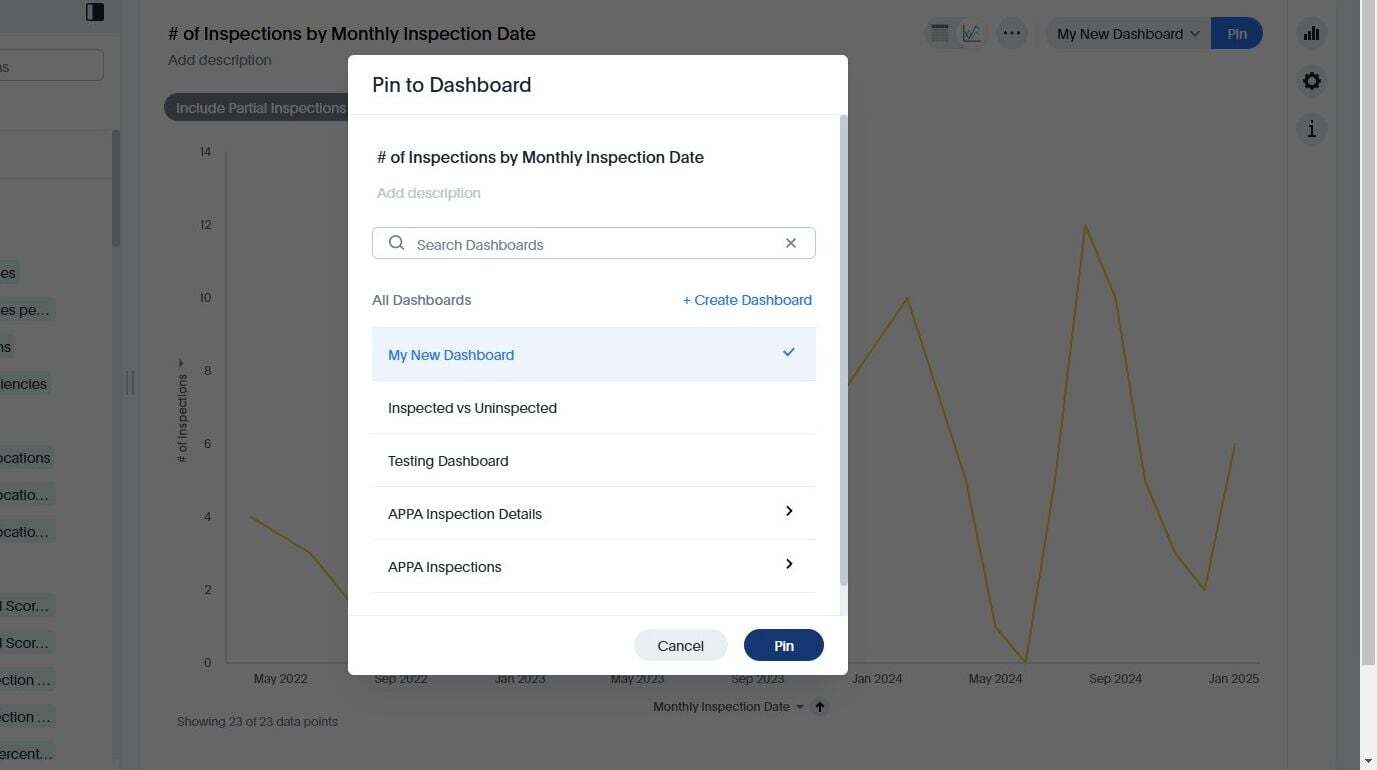
Select the dashboard you want to pin it to
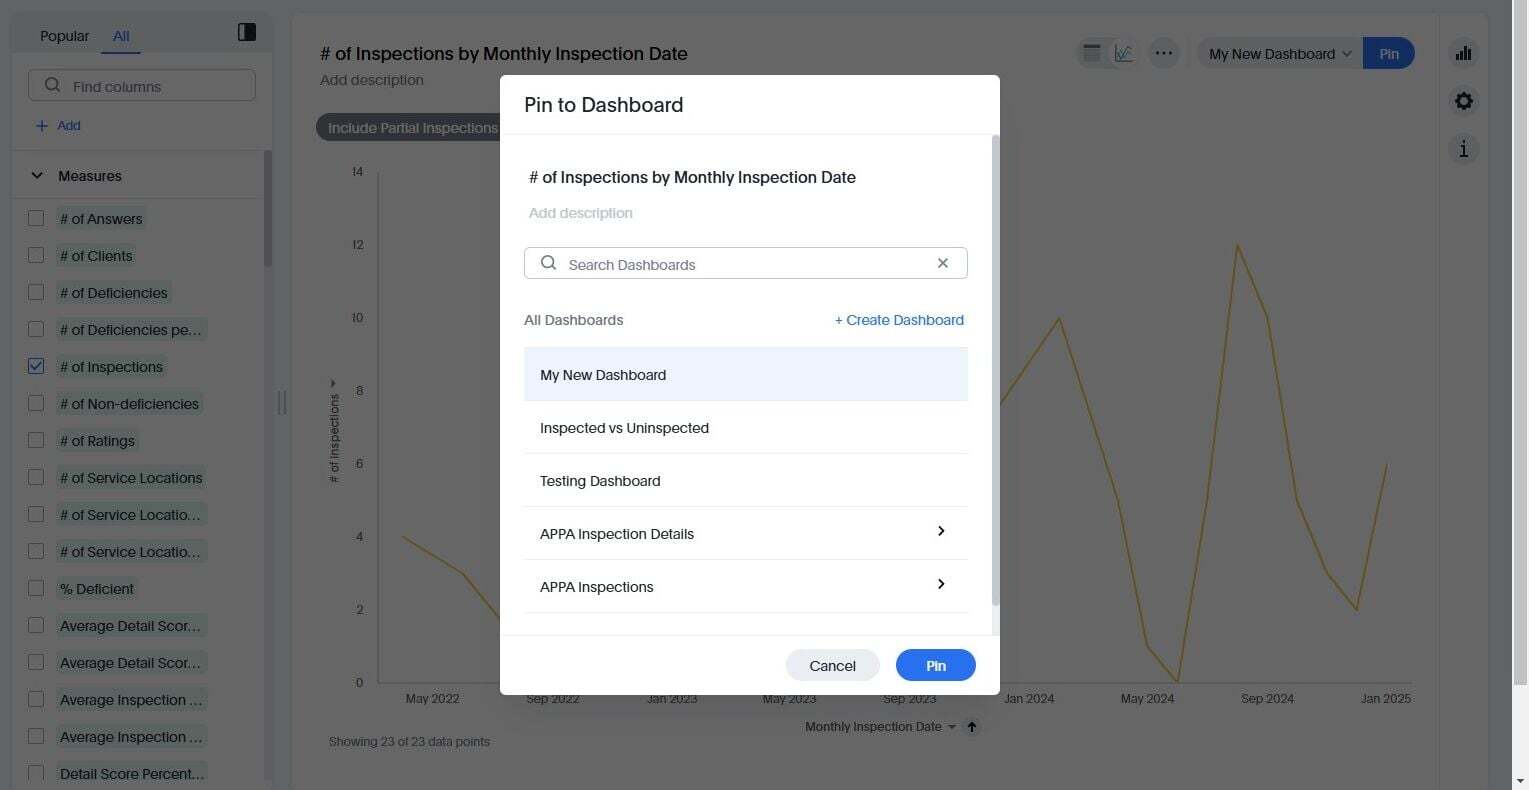
Click "Pin"
If you want to change the visualization to a different kind of chart, click here.
The available options will be clickable
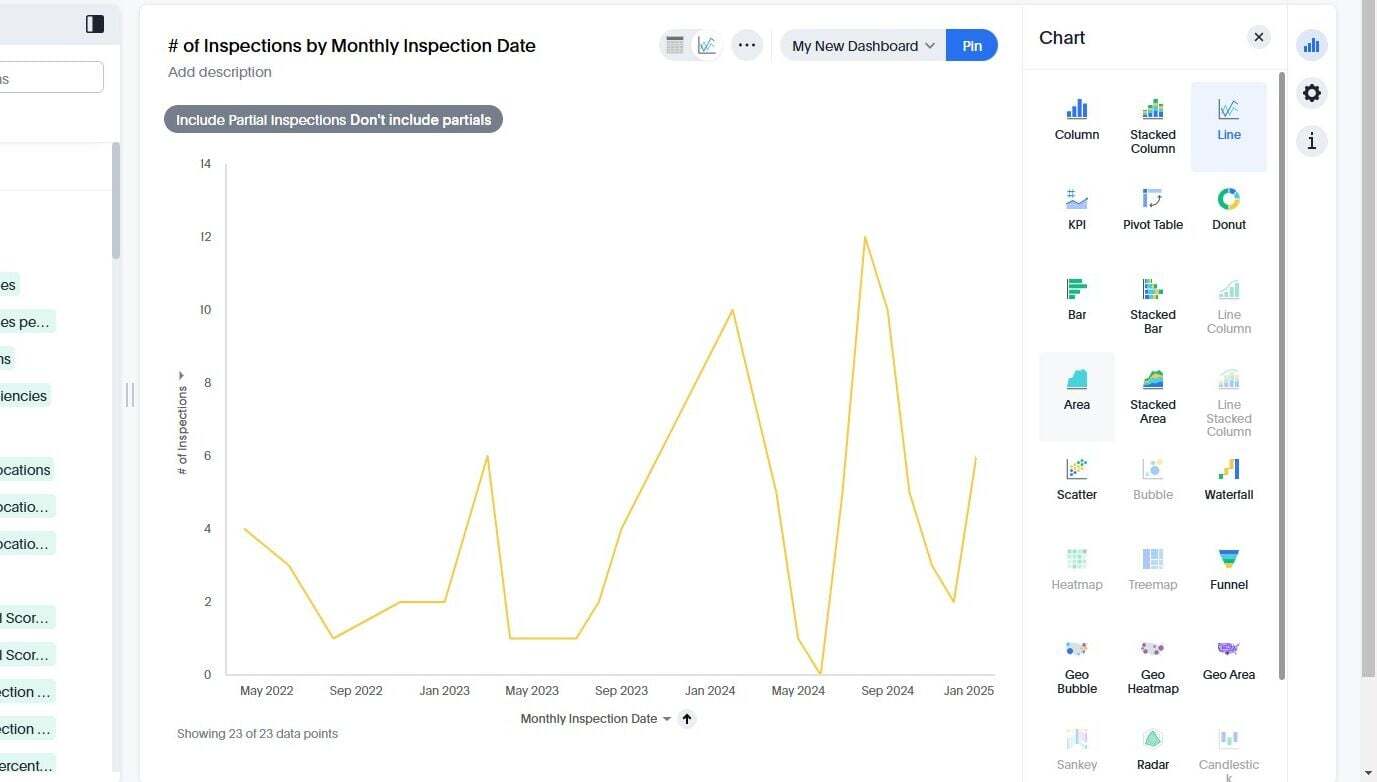
Click through them and find the one you like
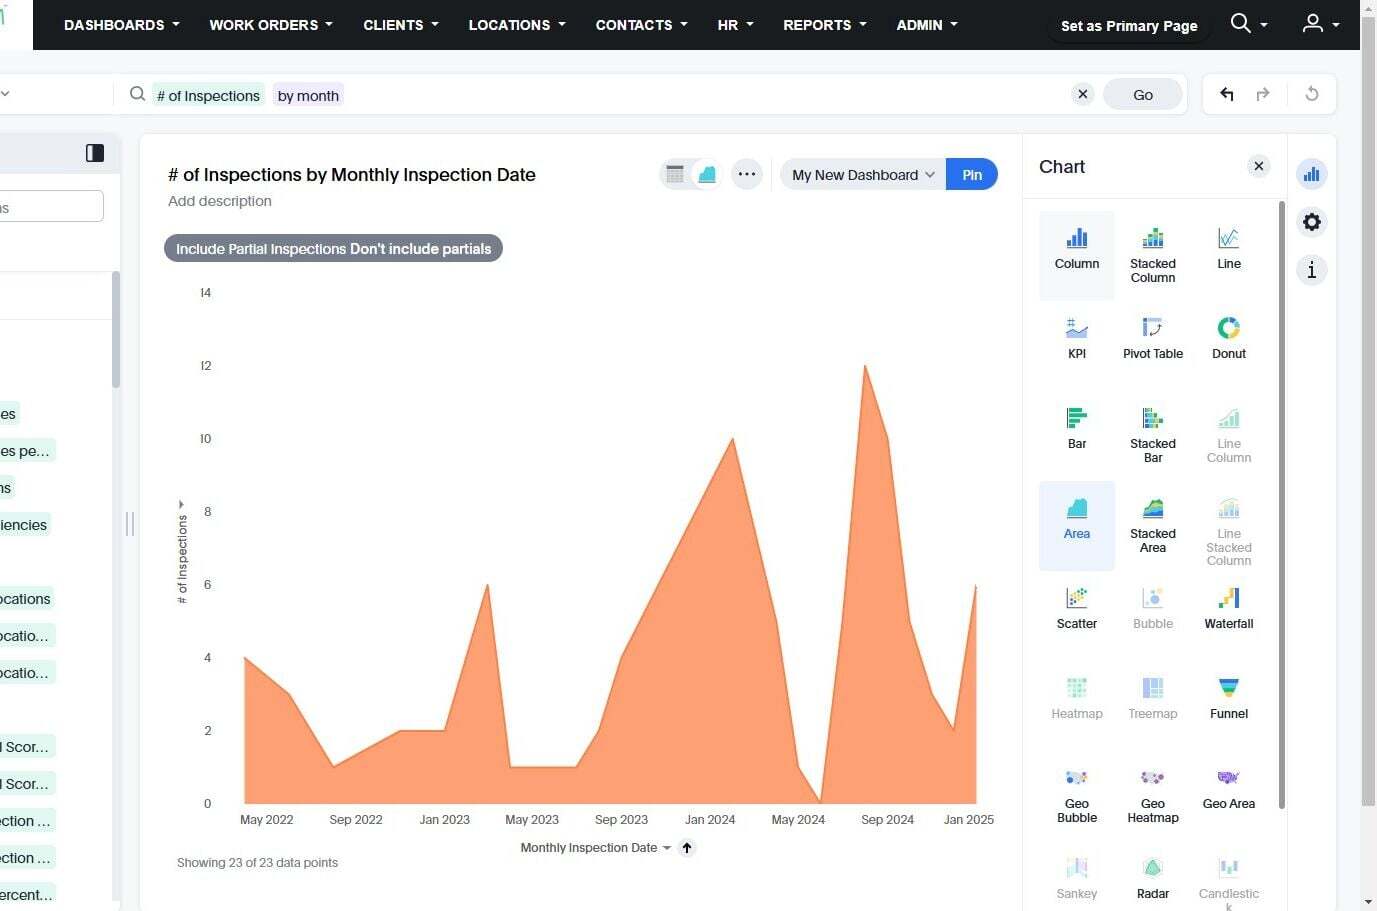
Once you find the visualization you like, you can edit the colors by clicking on the cog icon.
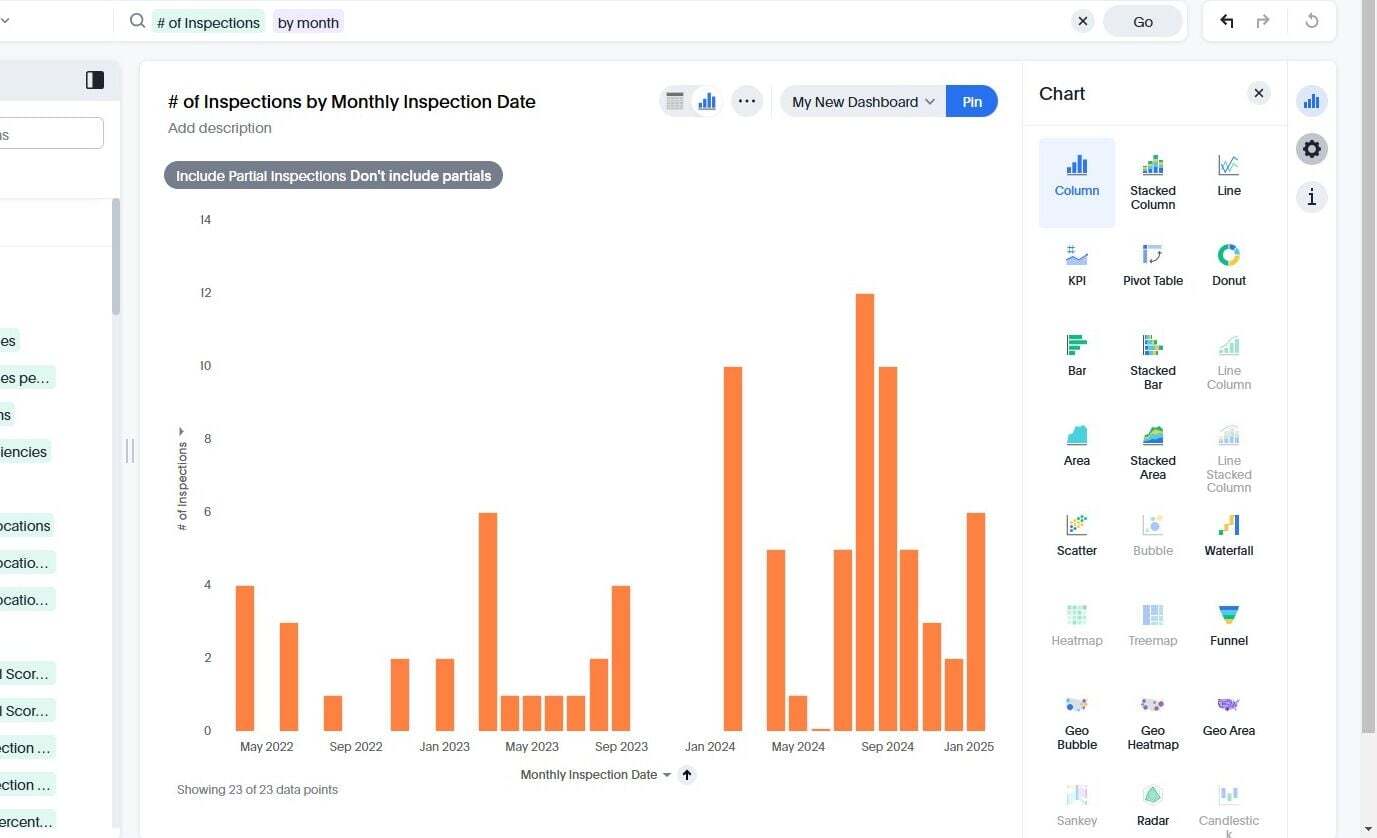
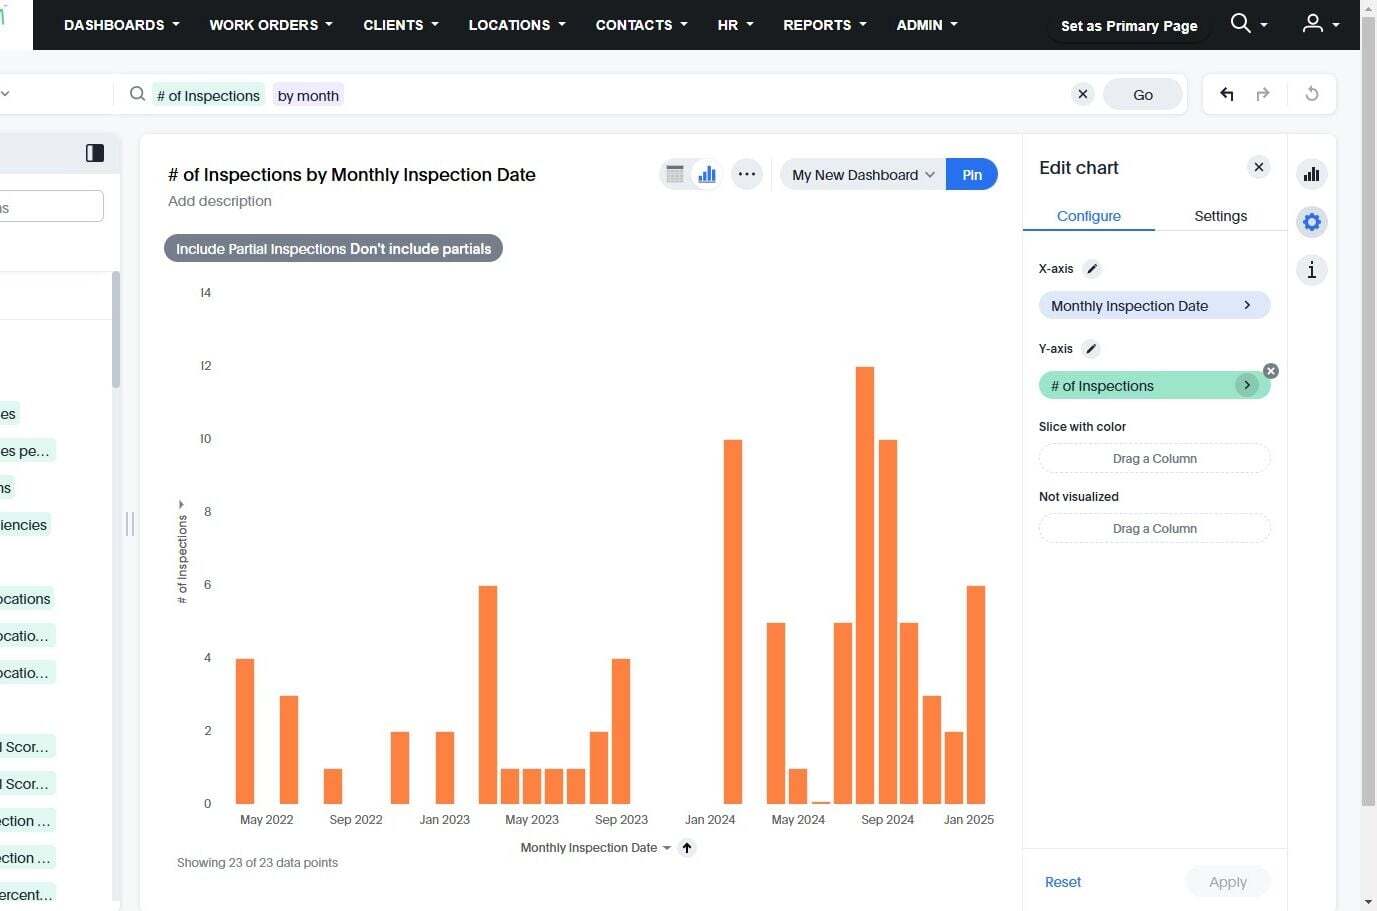
Select the arrow next to the value whose color you want to change
Click here to edit the color for the bars.
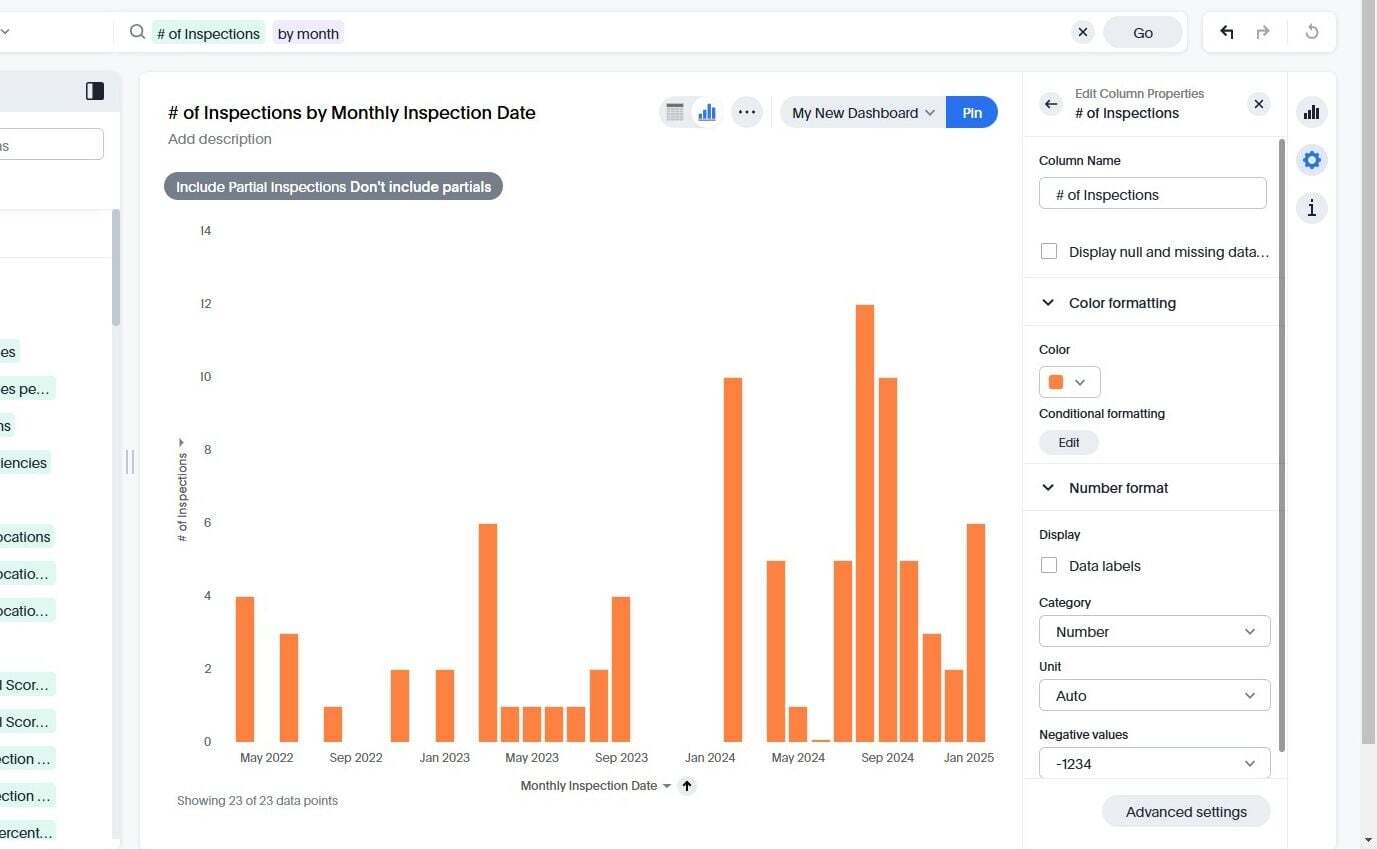
Select the color you want
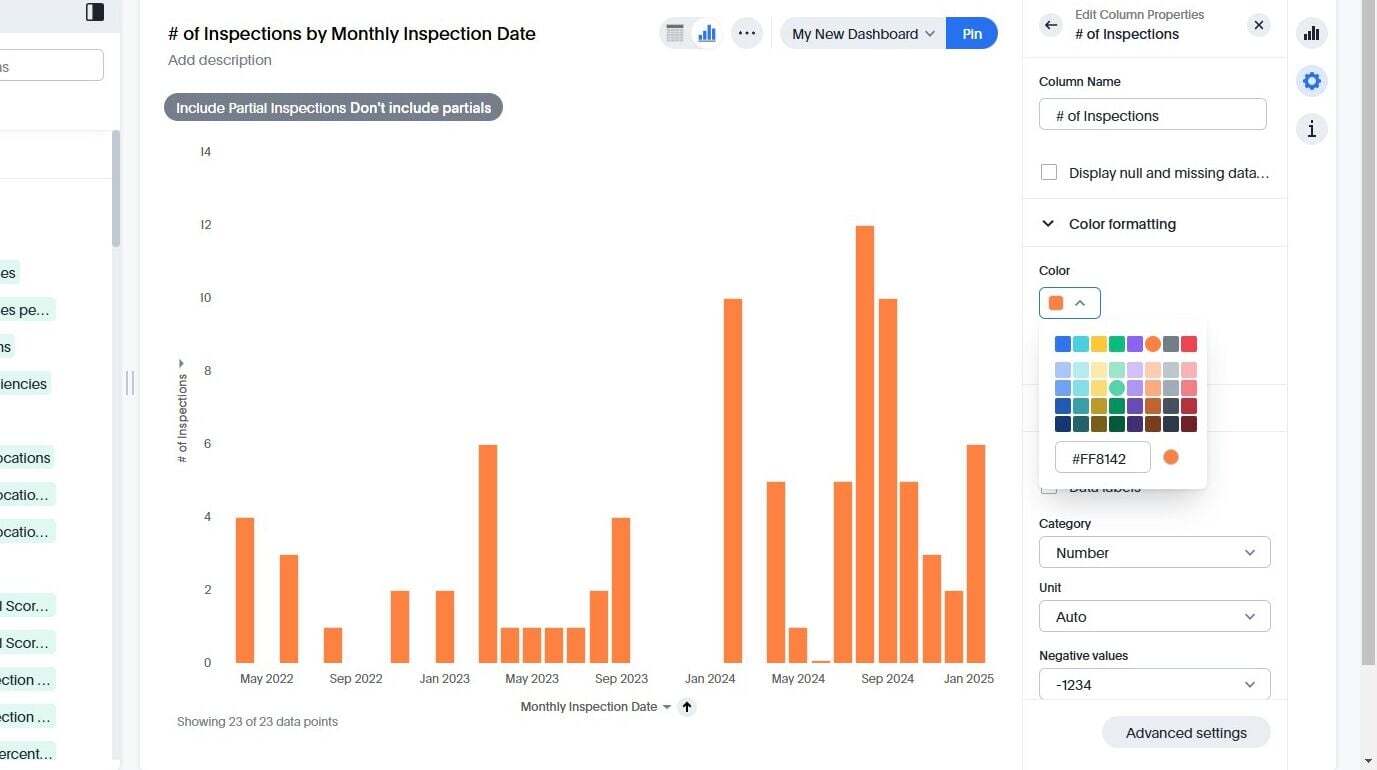
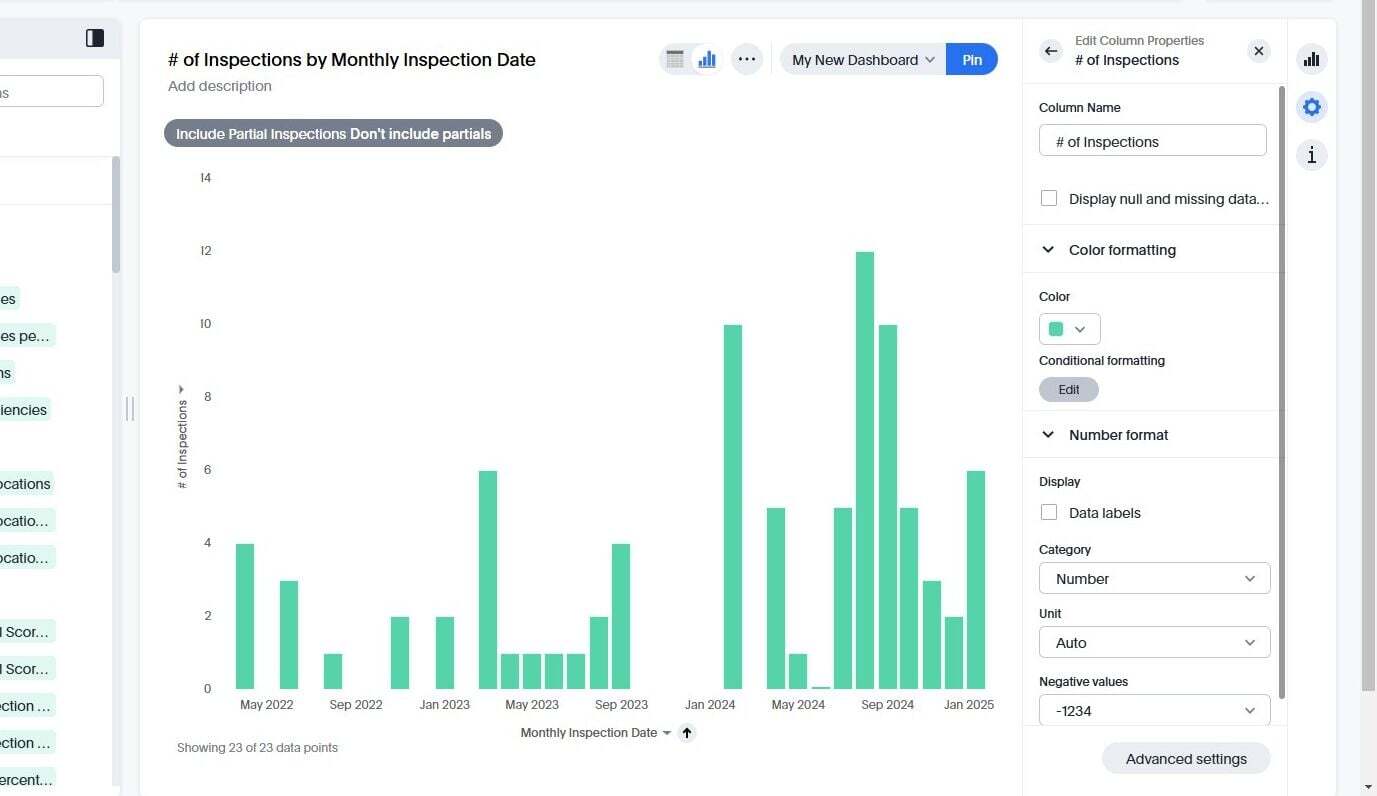
Conditional Formatting can be leveraged to change the color if the value is less than, or greater than, a certain amount. Click "Edit" under Conditional Formatting
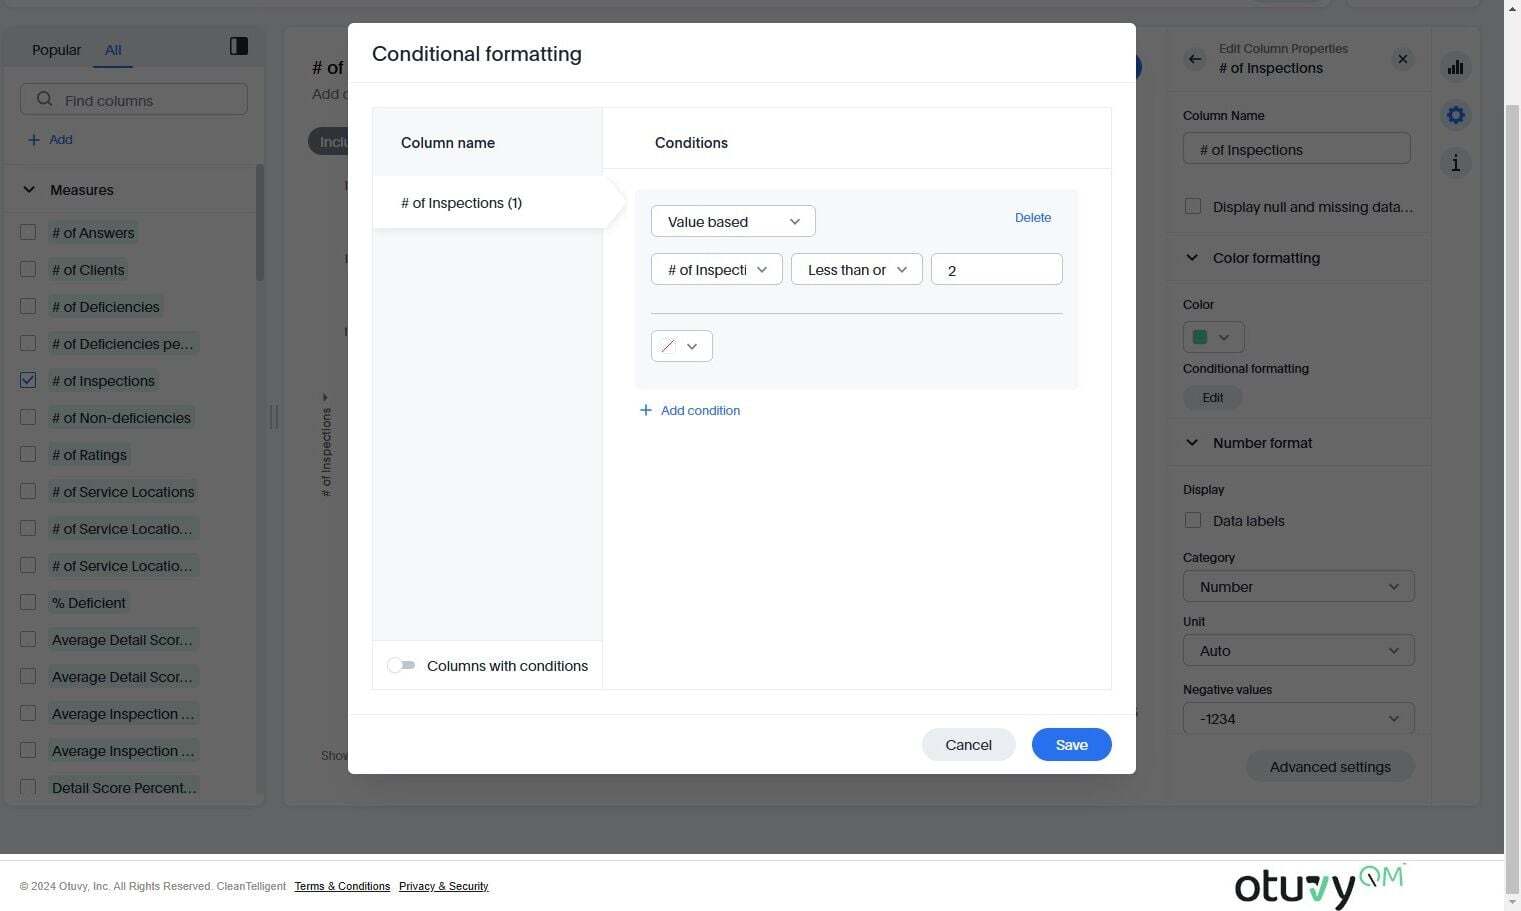
In this example we want the bar to be red if there are 2 or fewer inspections in a month.
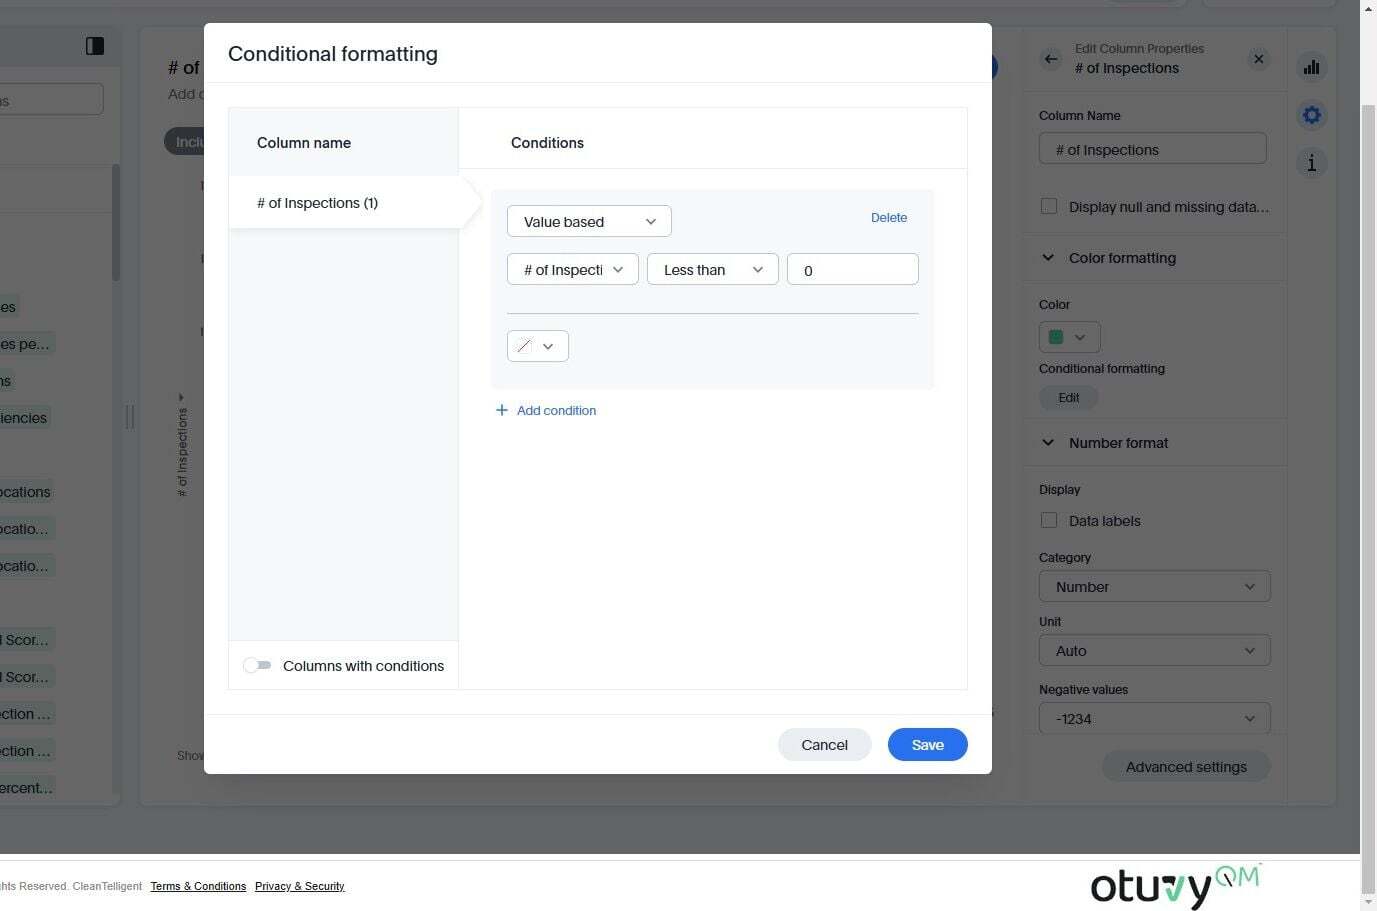
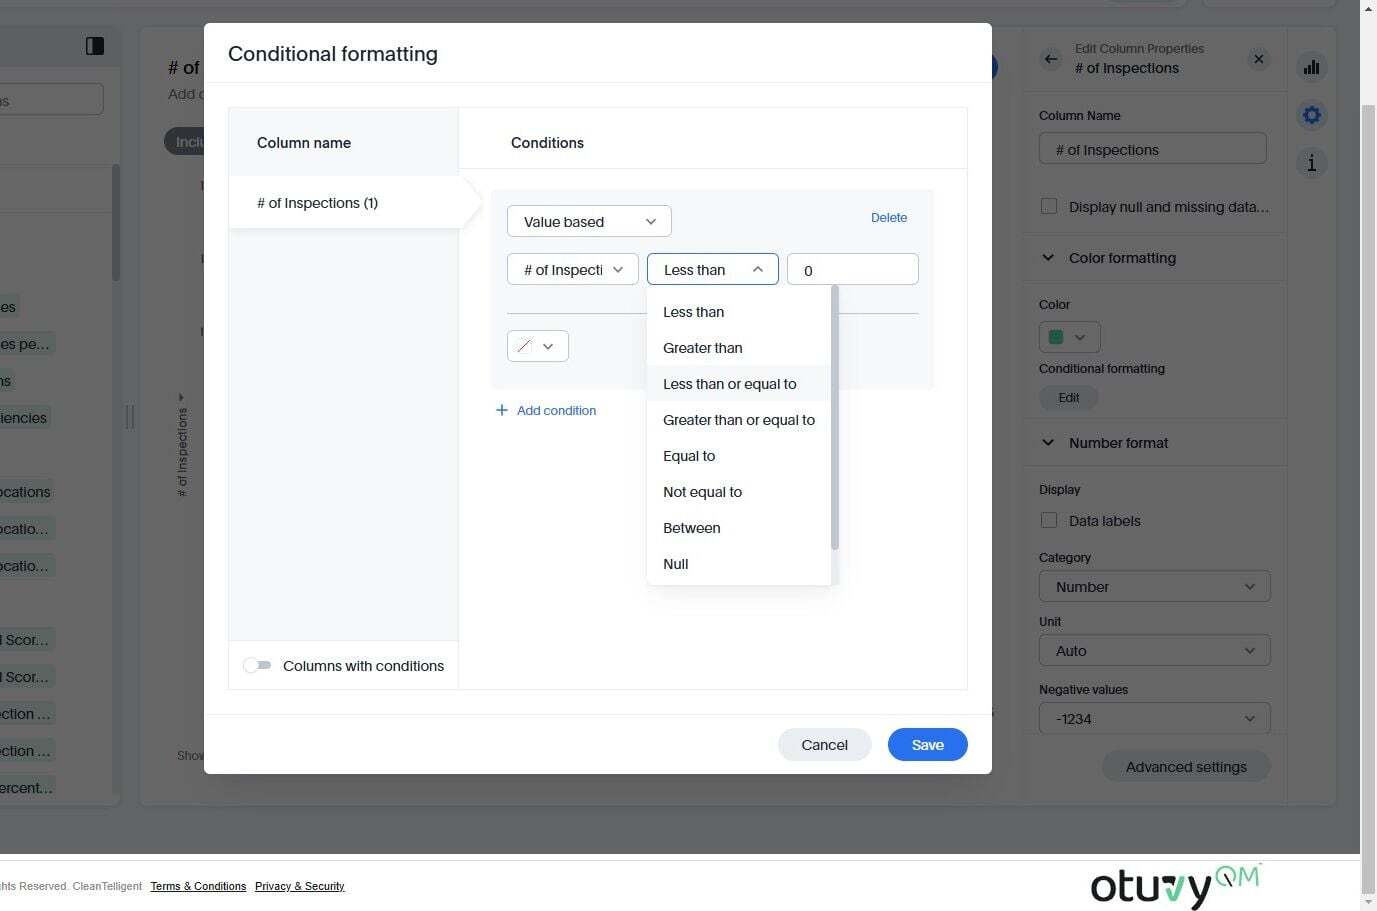
We're choosing the option "Less than or equal to" because we want it to include the number we're putting to the right
Click the "Value" field and input 2.
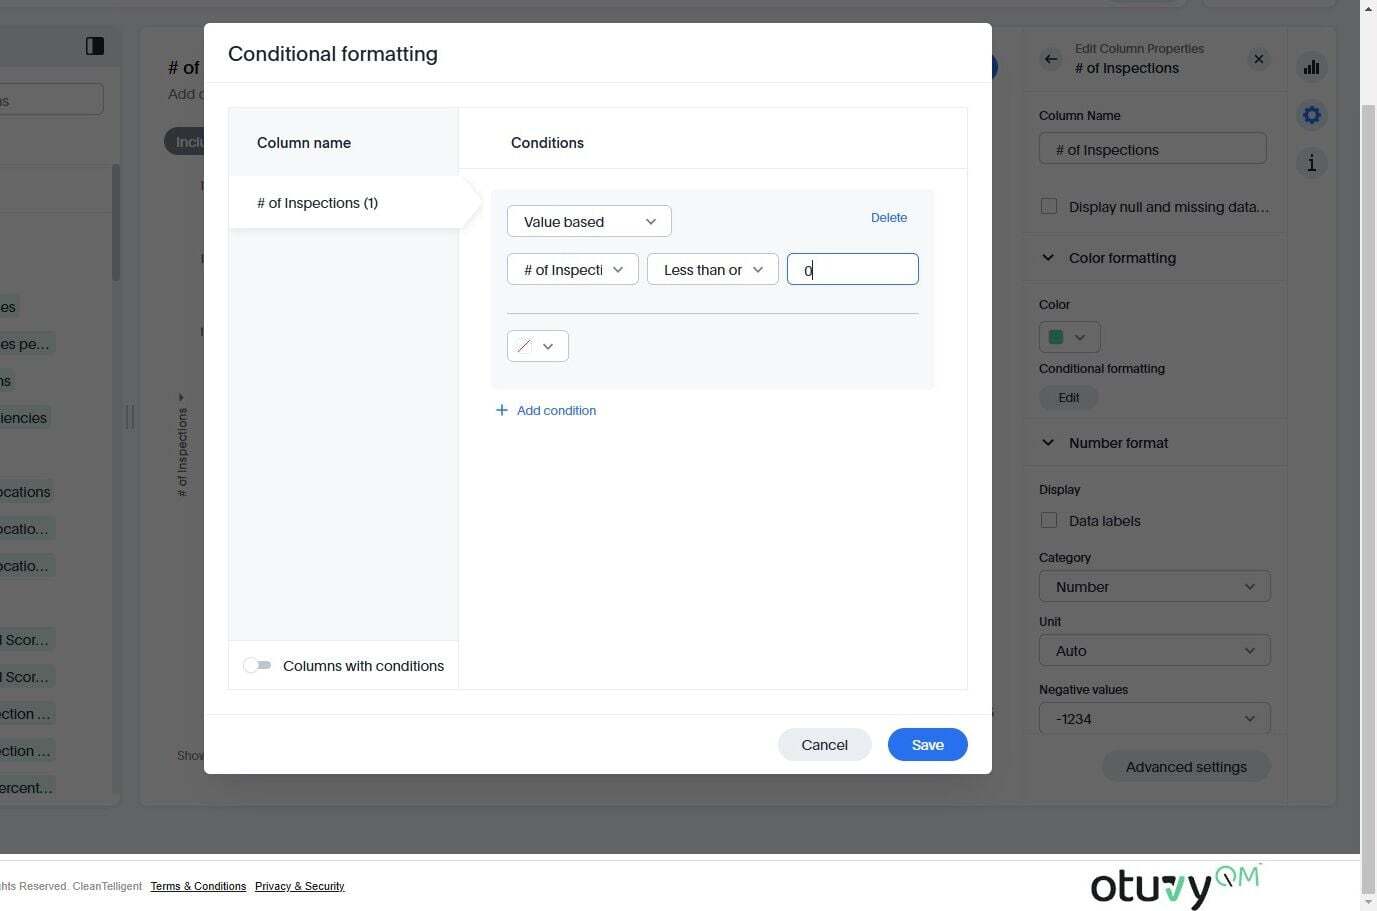
Click this icon.
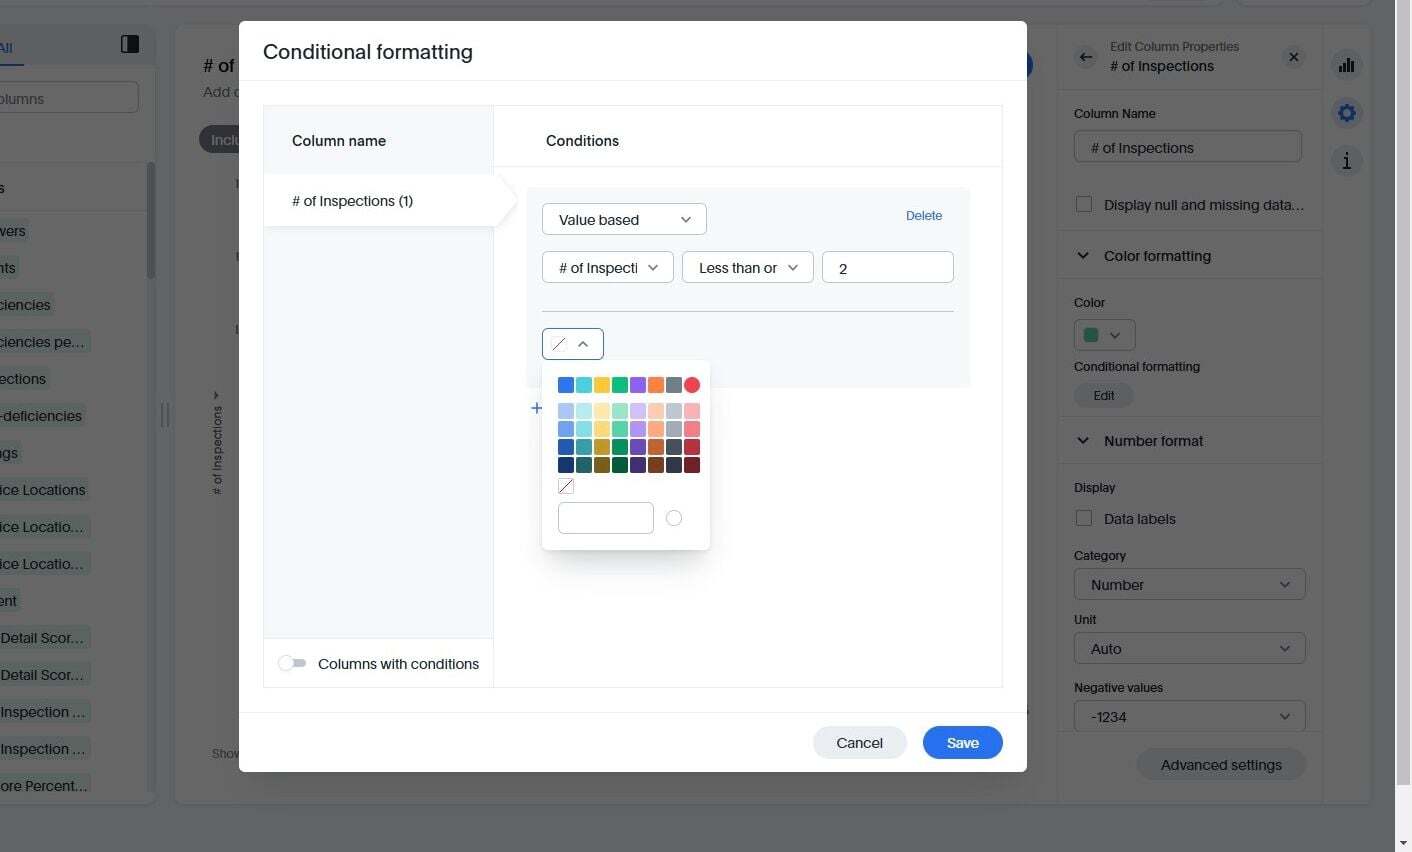
Select the color you want. In this case we've selected a Red color. You can also enter in the hexadecimal code for the color in the text field below the colors.
Click "Save"
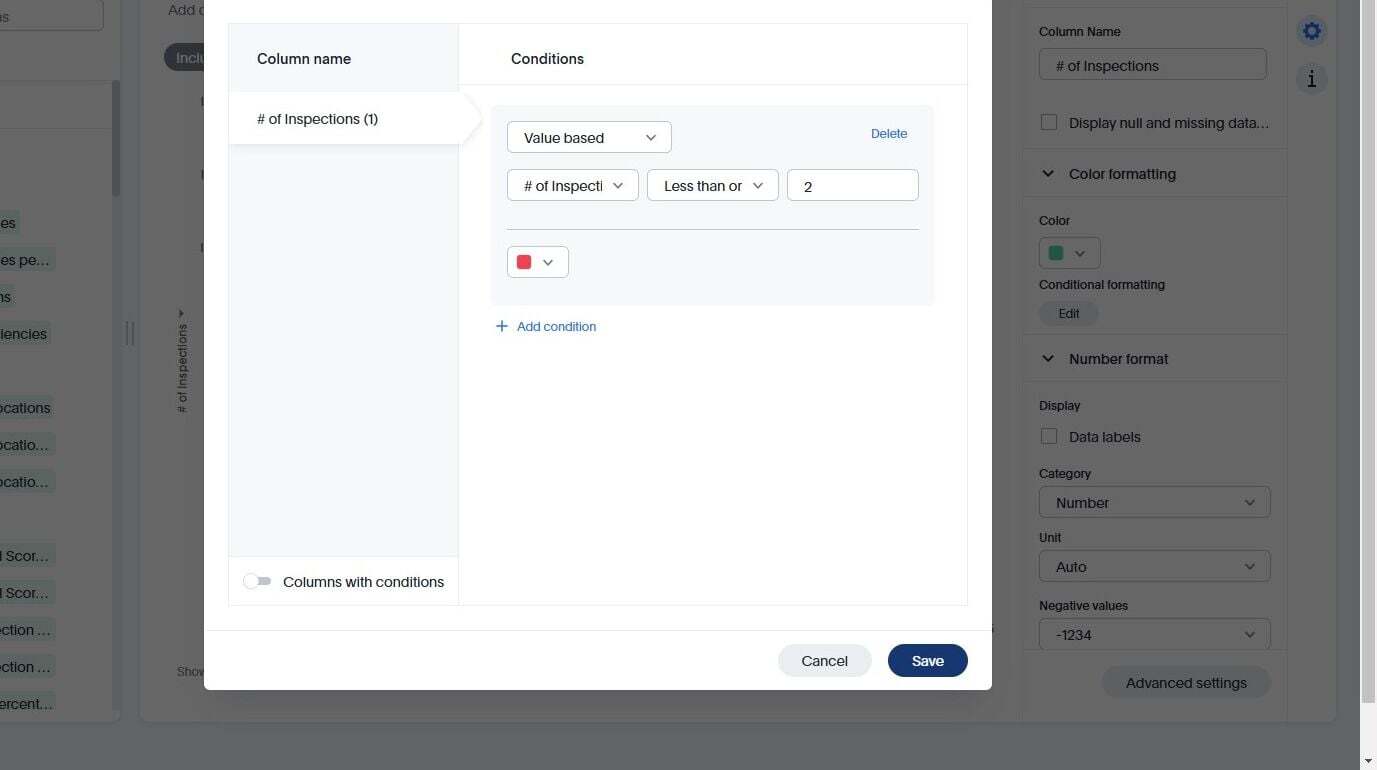
Be sure to "Pin" the new visualization to a dashboard.
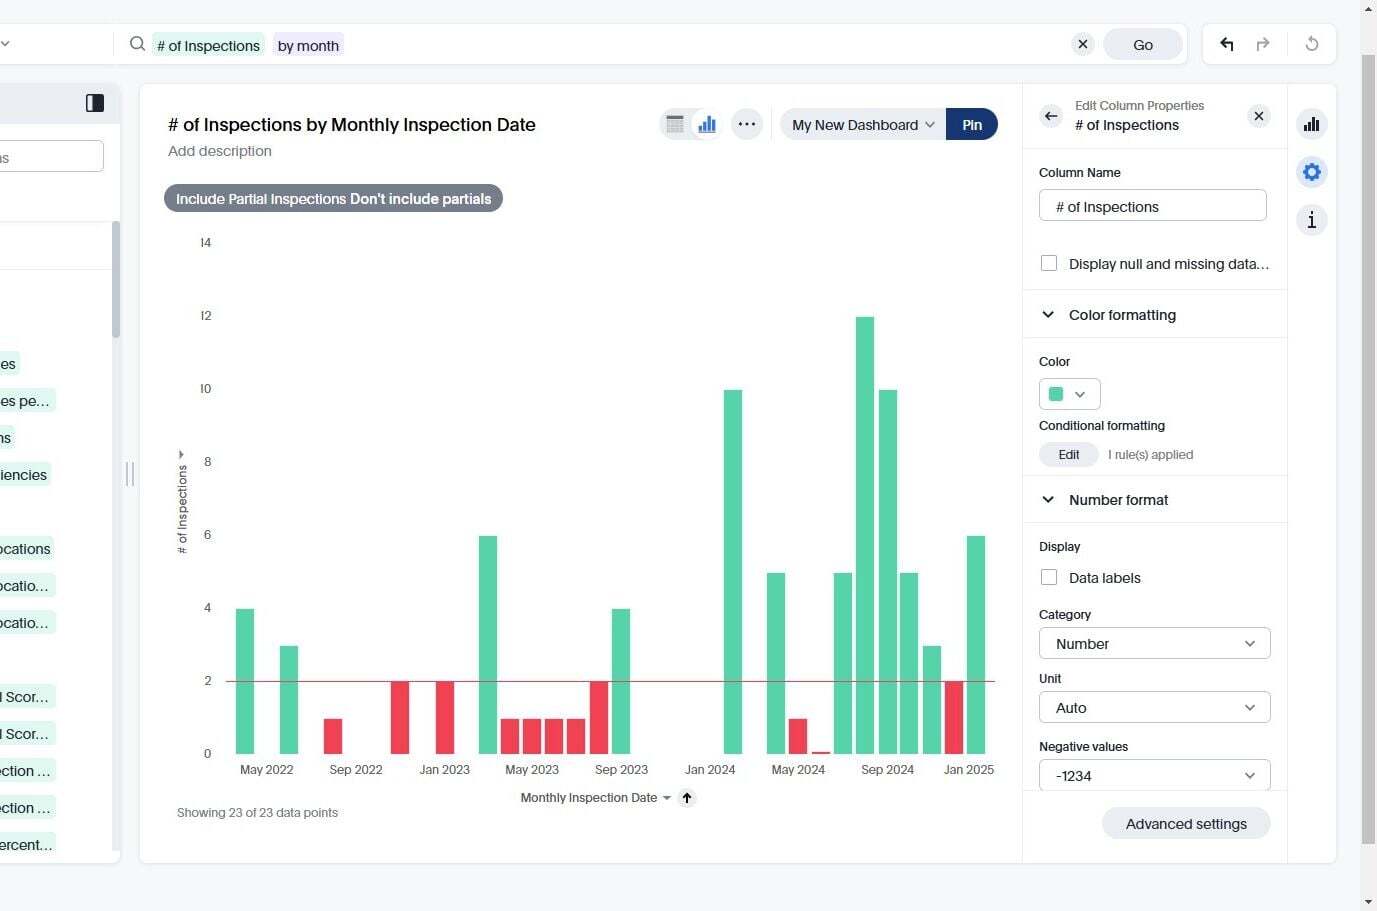
Now we have 3 dashlets on our "My New Dashboard" dashboard. Lets go see them by going back to the "Collection" page
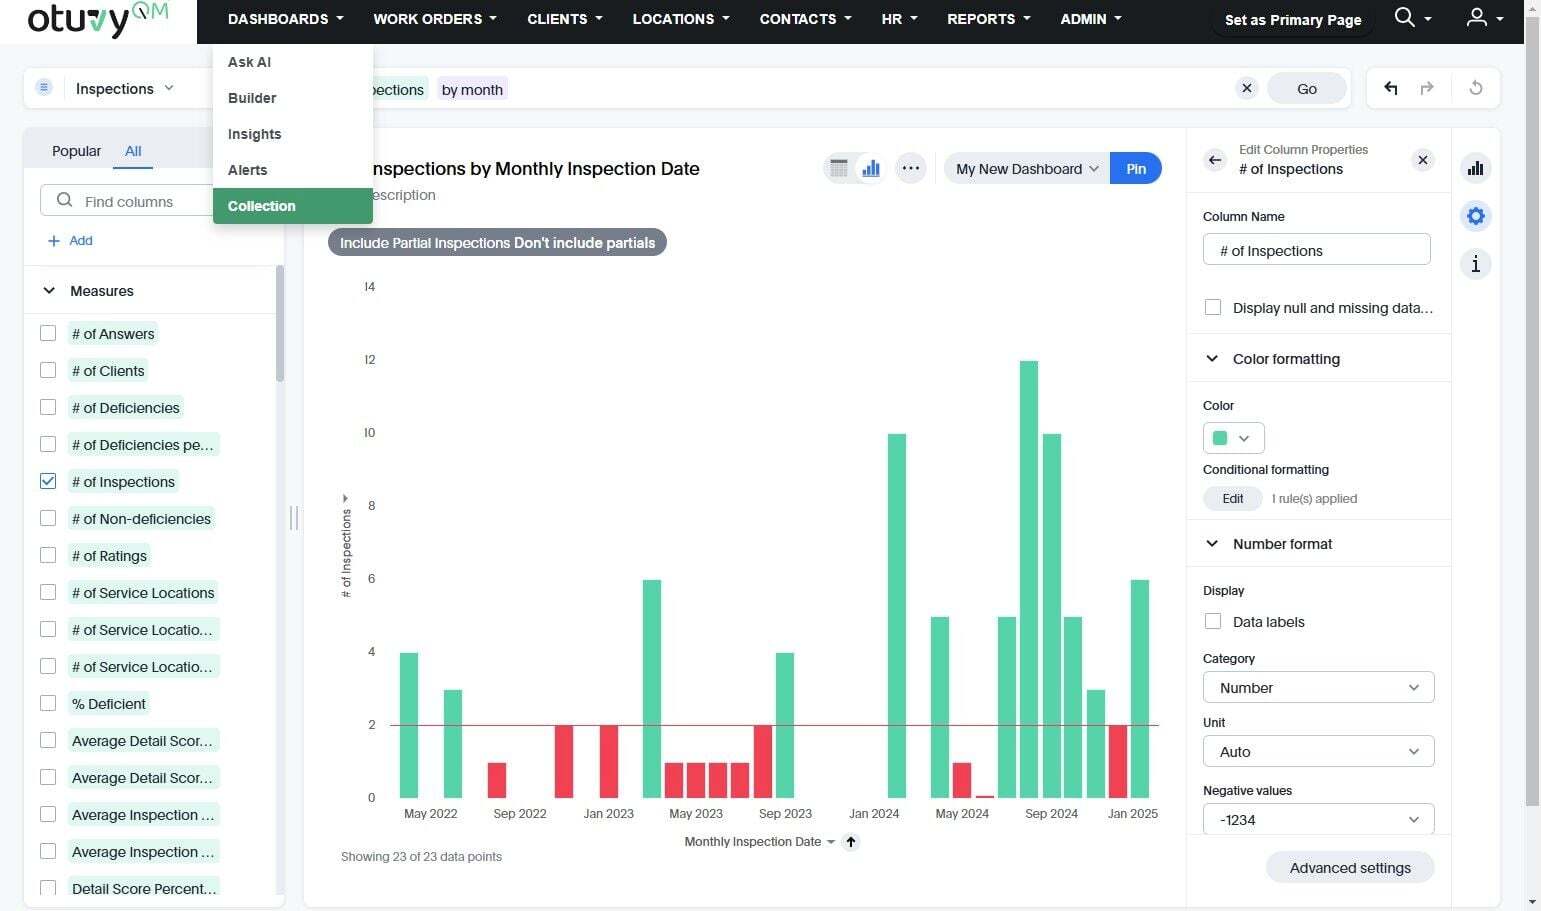
Click on the dashboard where you pinned your dashlets
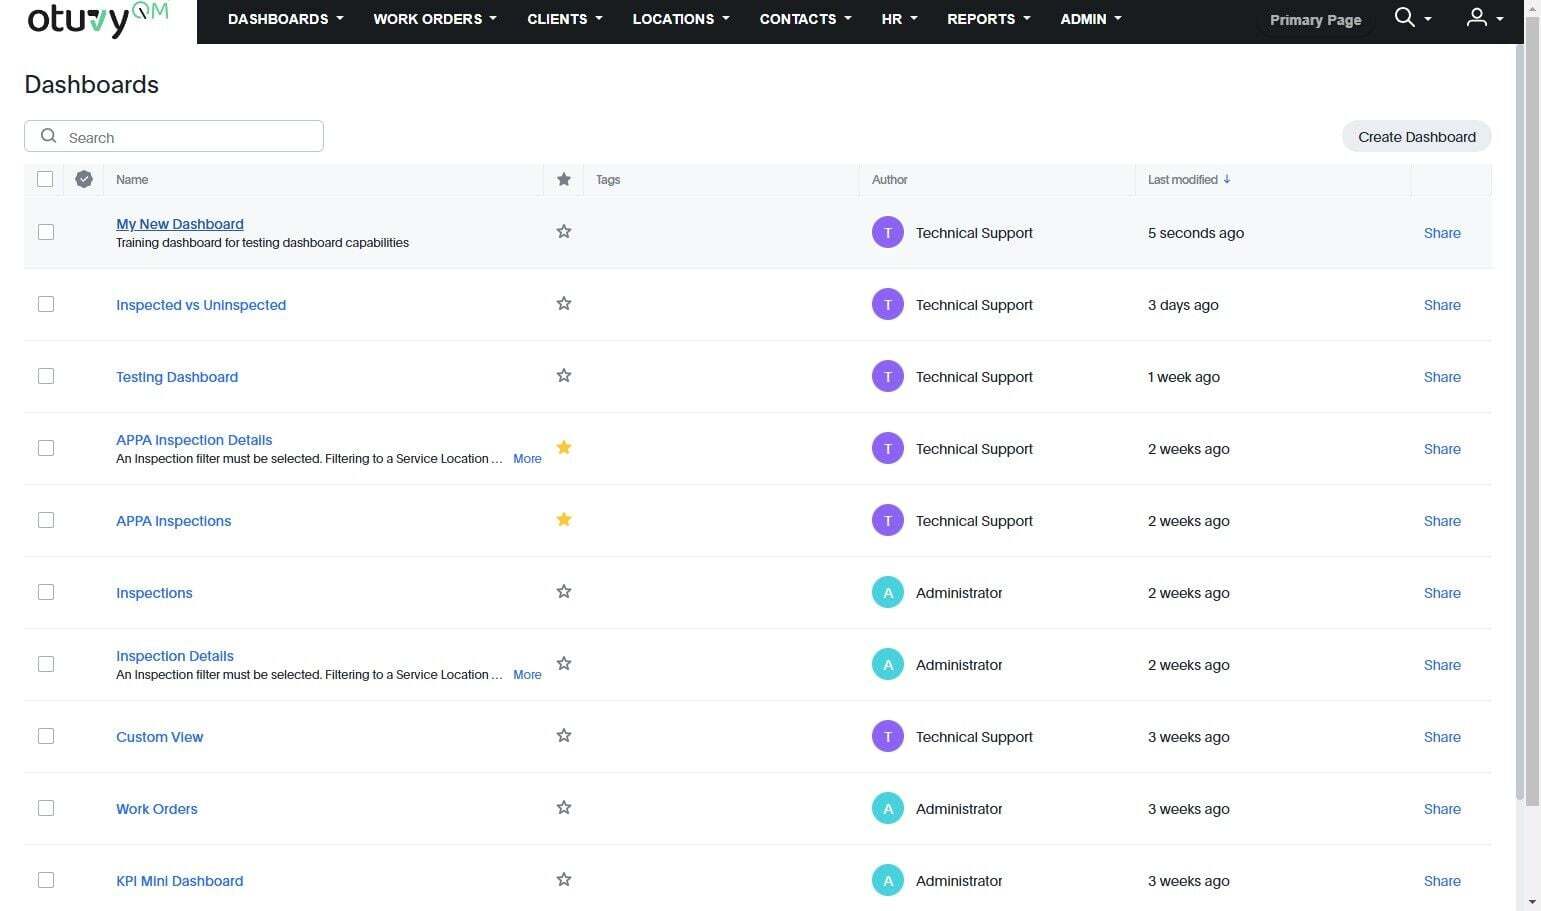
## Edit a Dashlet
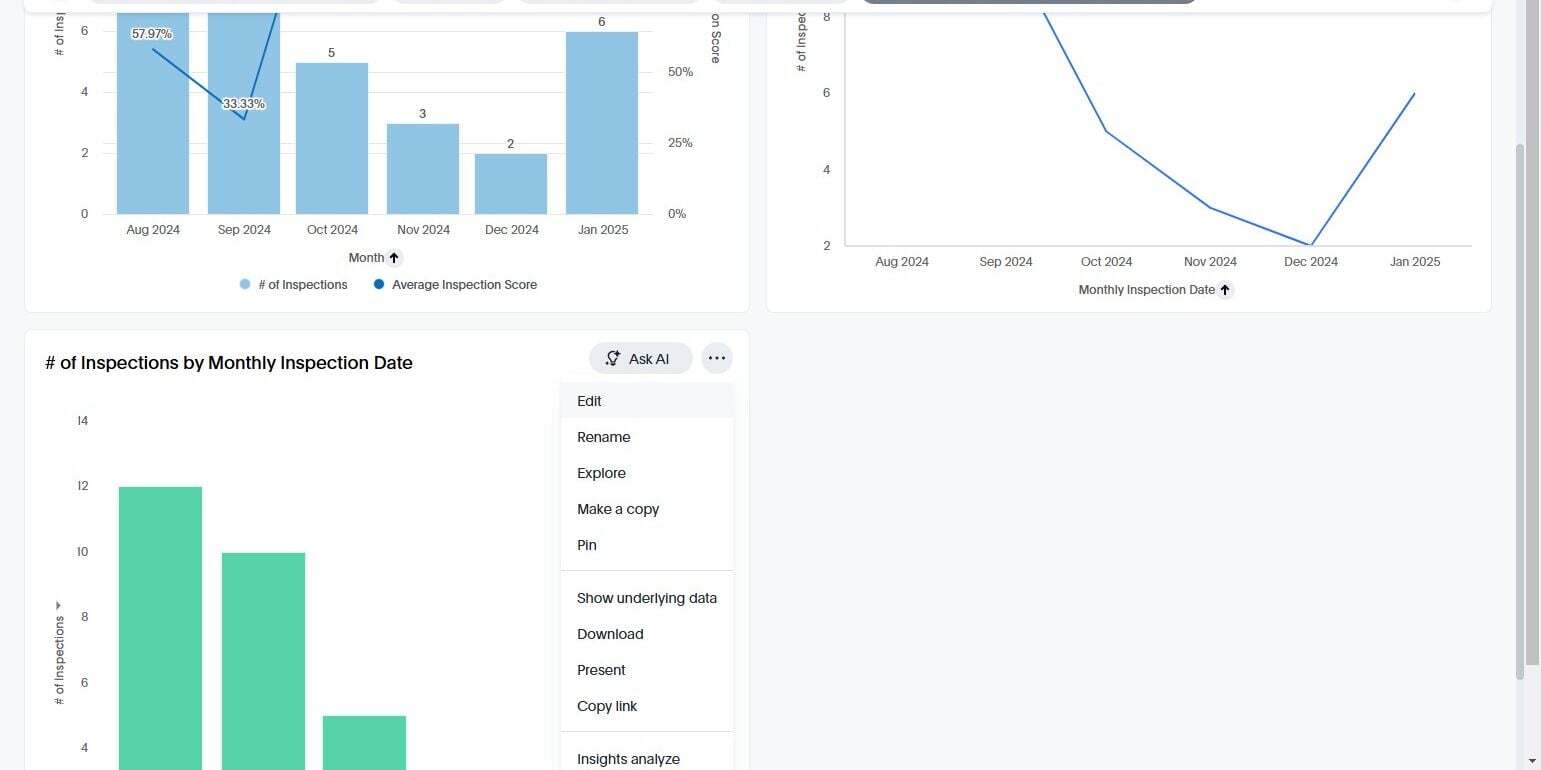
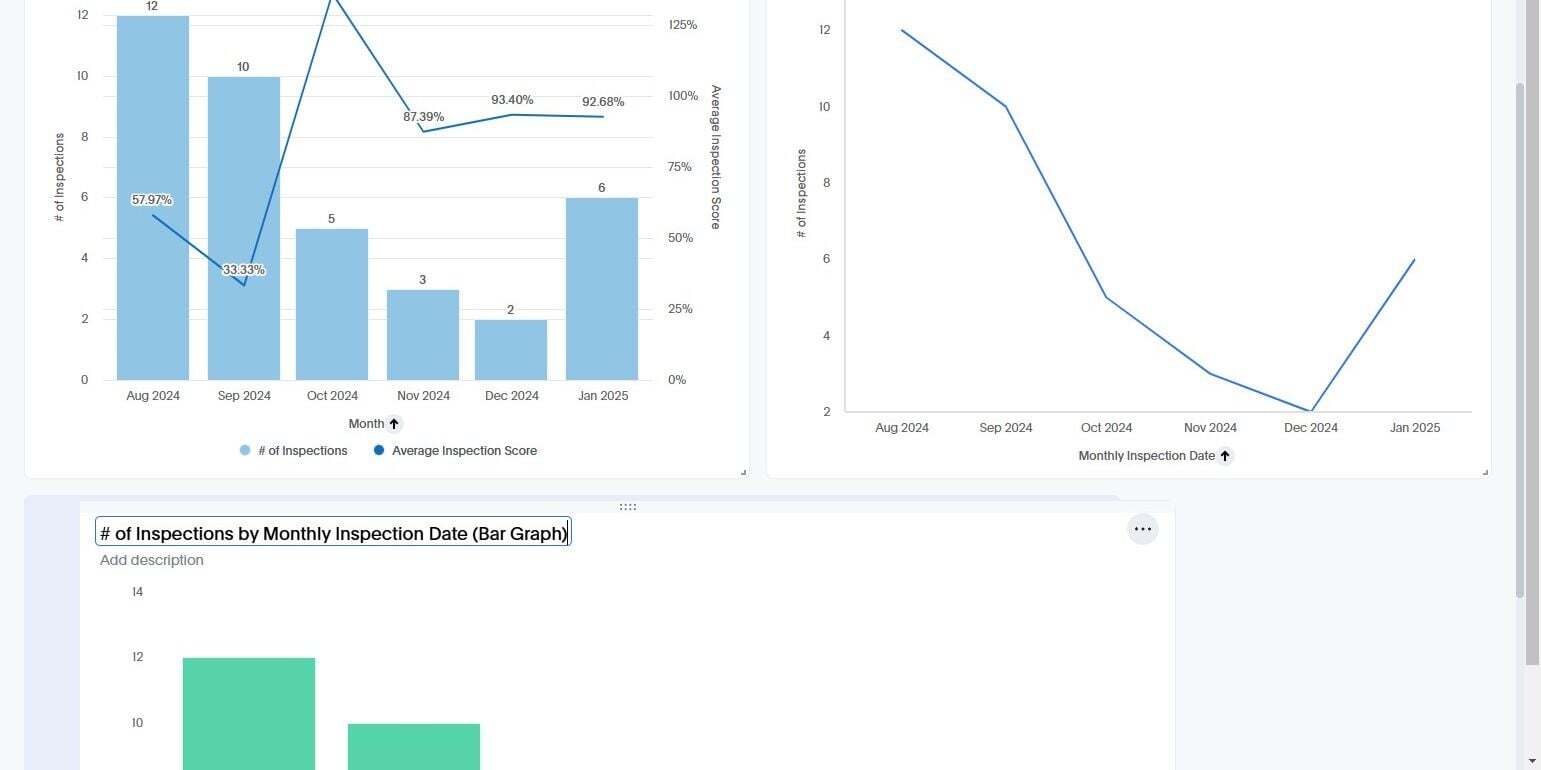
Lets edit a dashlet to change the name or anything else we want. Editing a dashlet only affects that dashlet. If you pinned it from somewhere else it will not affect where you pinned it from. While hovering your cursor over the dashlet you want to edit, click this icon.
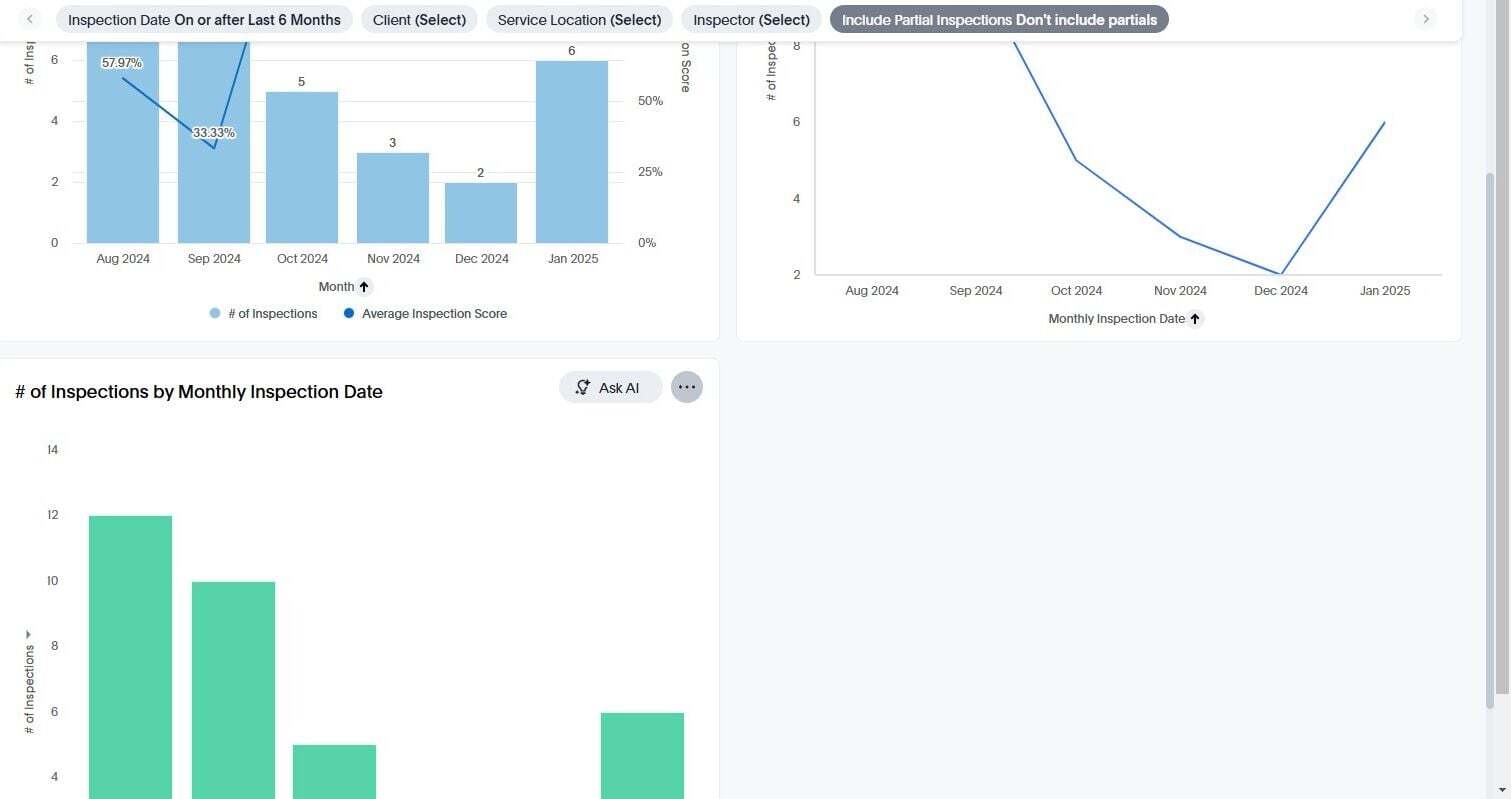
Click "Edit" from the menu that appears
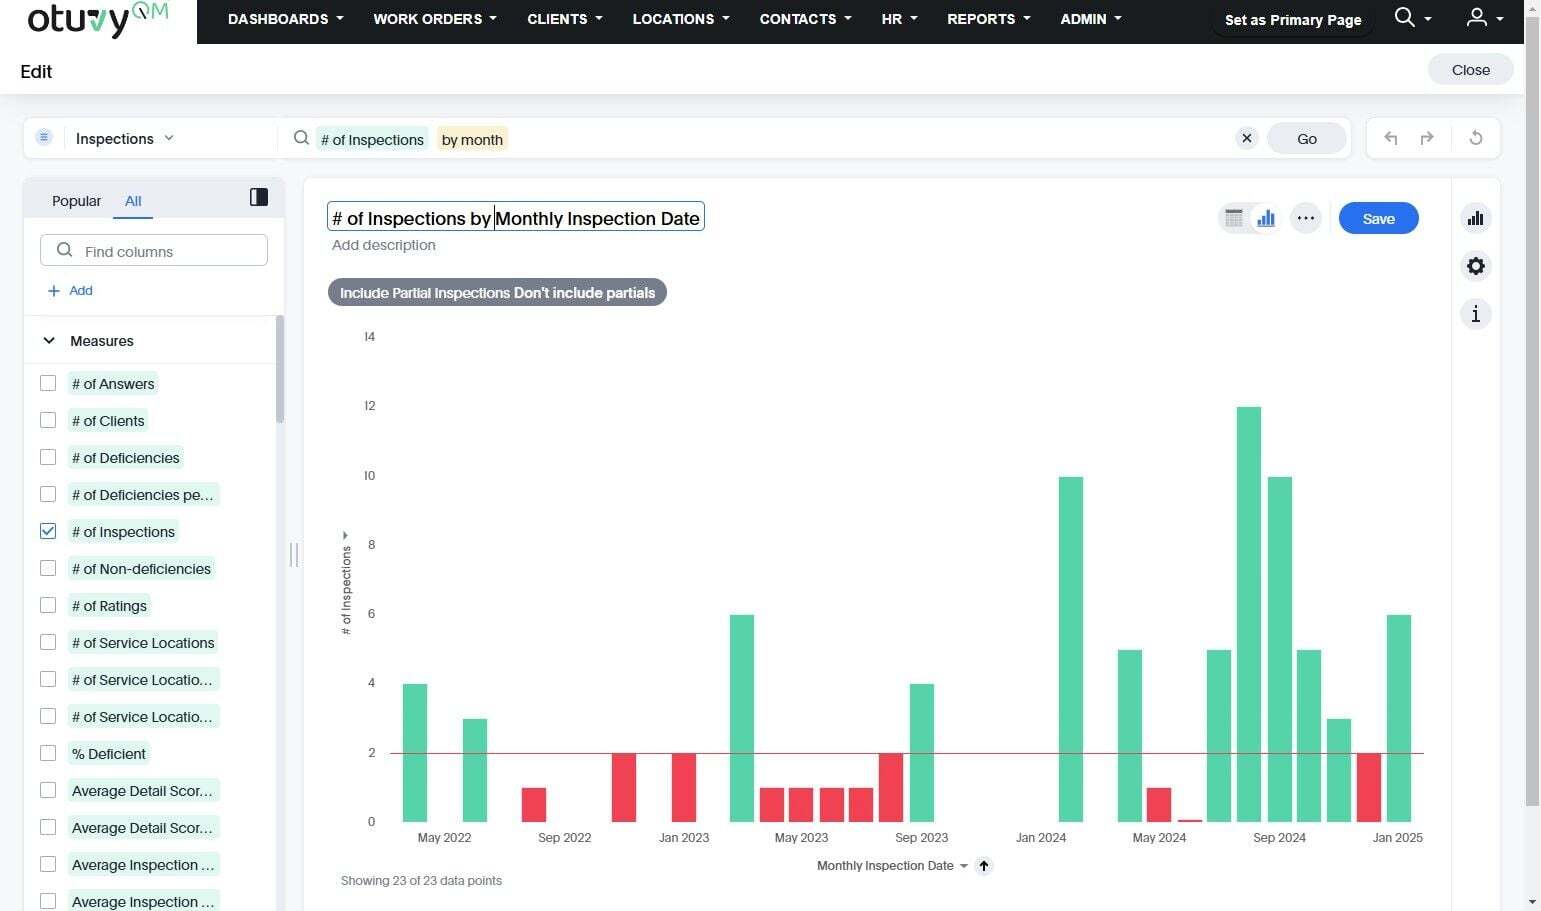
Lets edit the name of the dashboard here
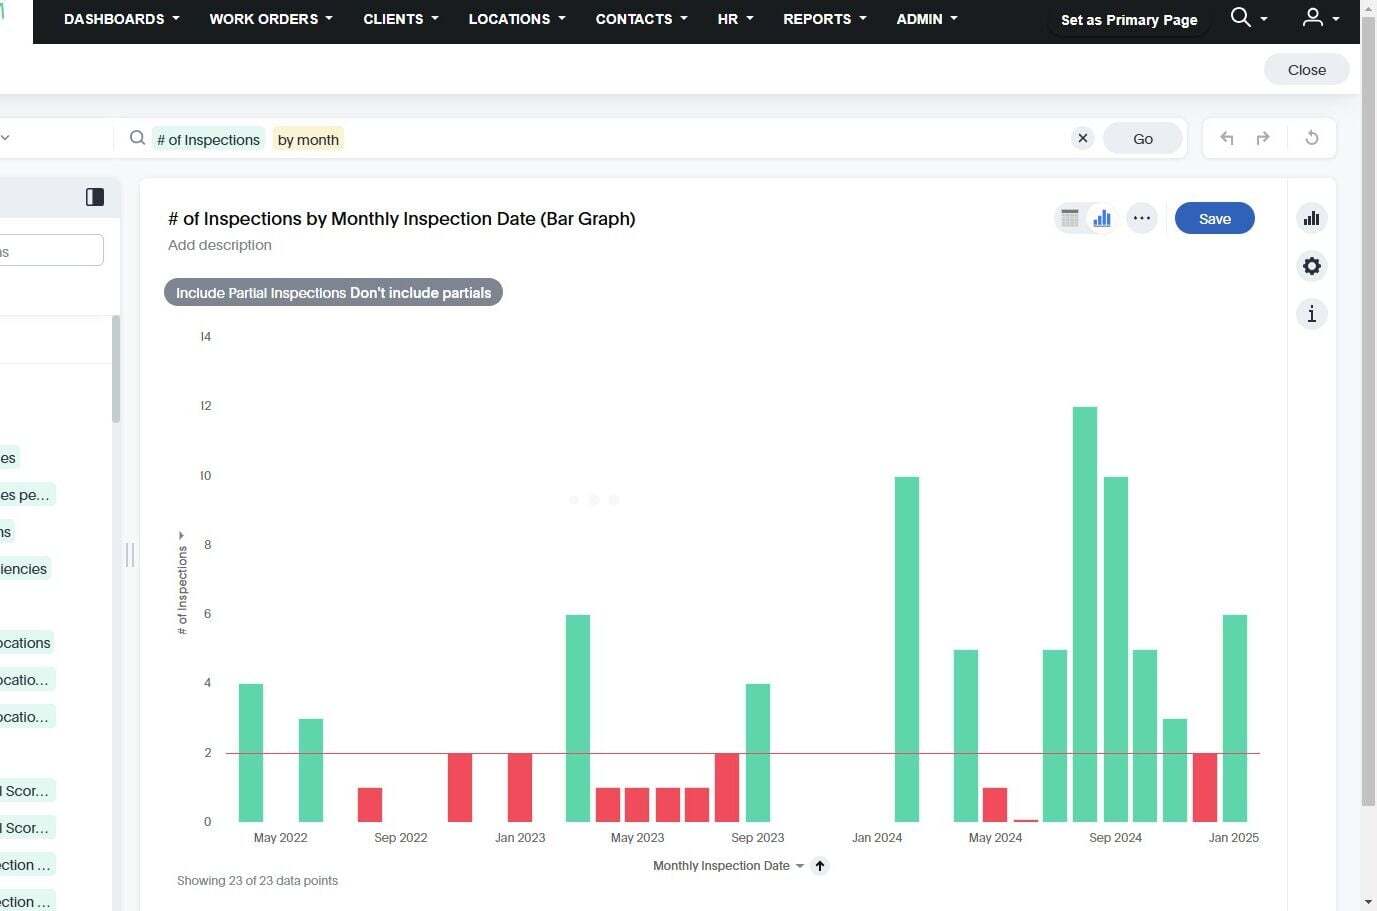
And then click "Save"
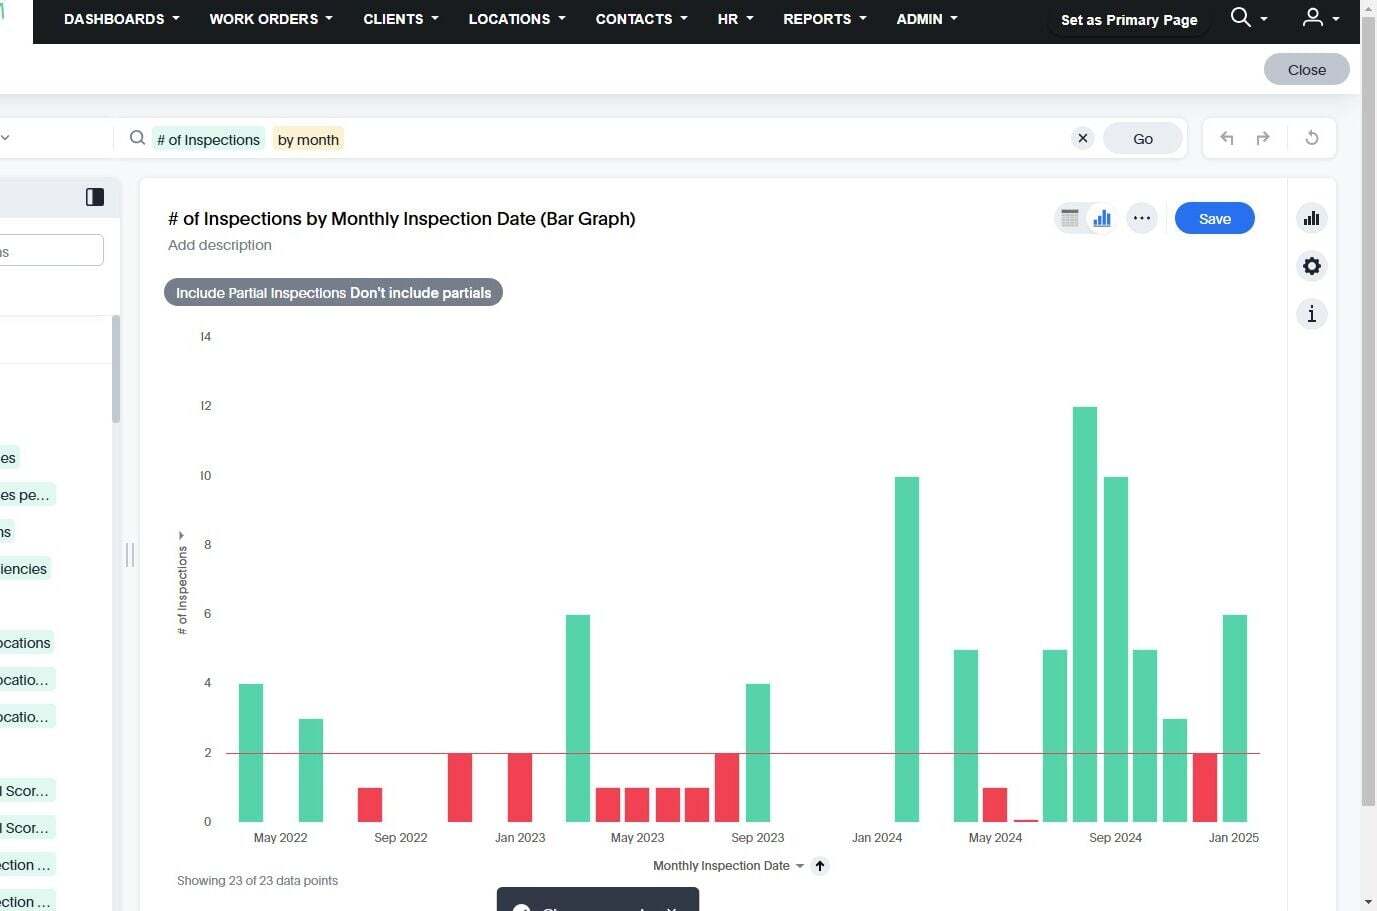
Now that all the changes are saved we can click "Close"
## Resize and Reposition Dashlets
If we want to resize or reposition dashlets on a dashboard we will need to edit the dashbaord. Click this icon at the top-right of the dashboard you want to edit
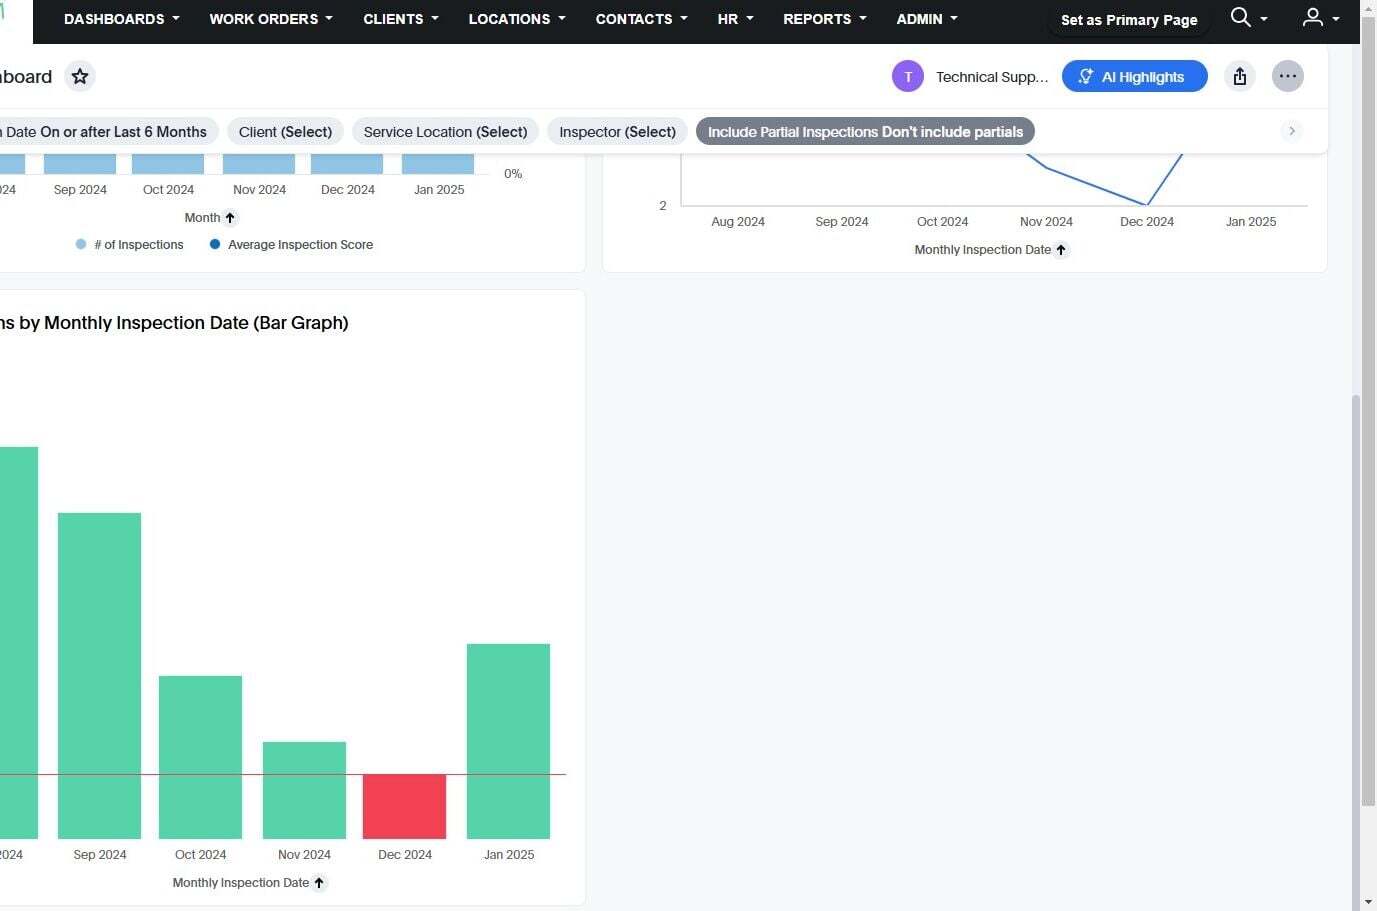
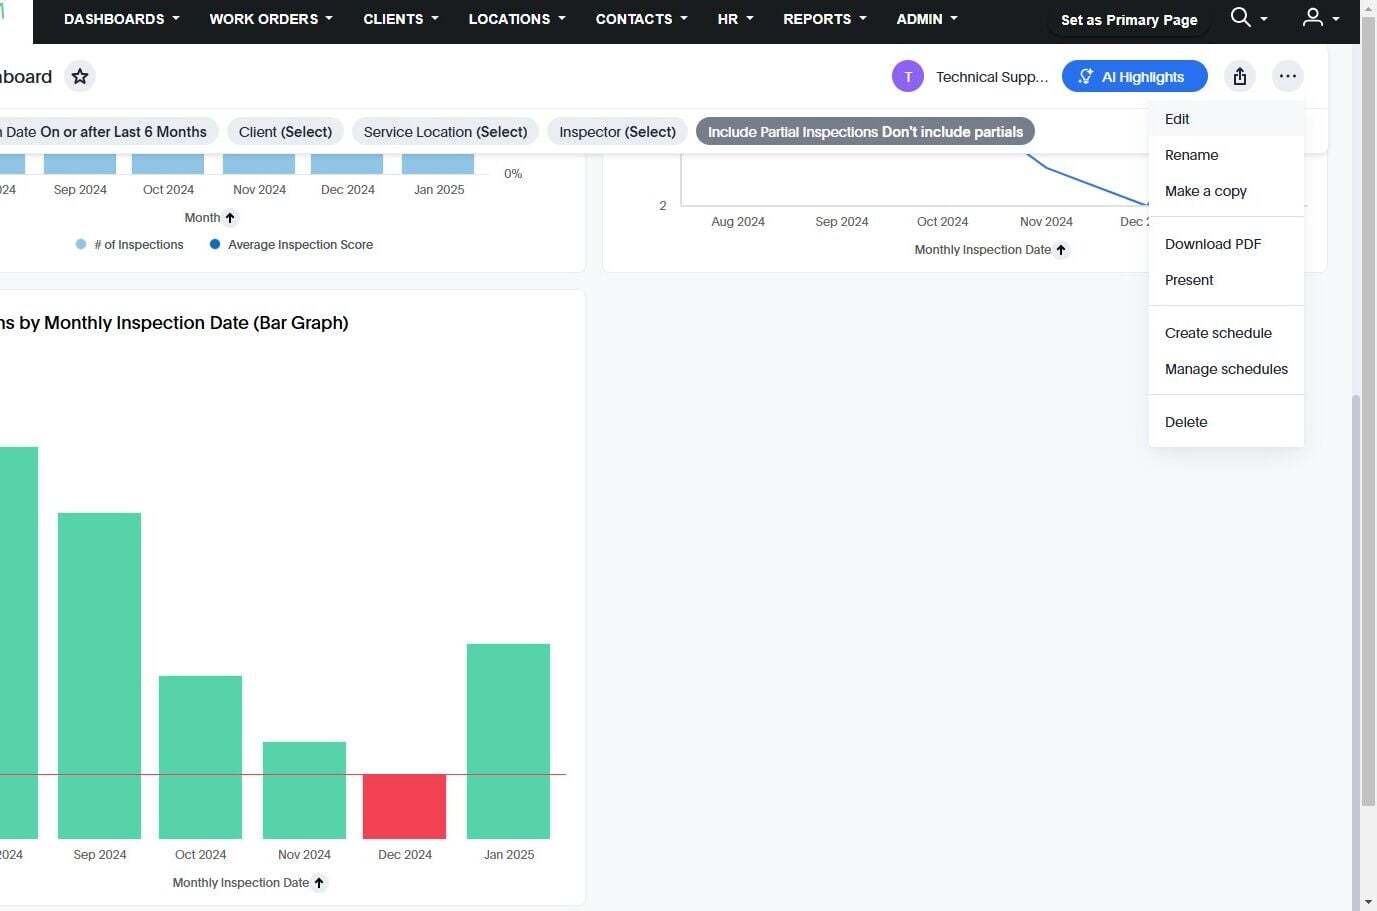
Click "Edit" from the menu that appears
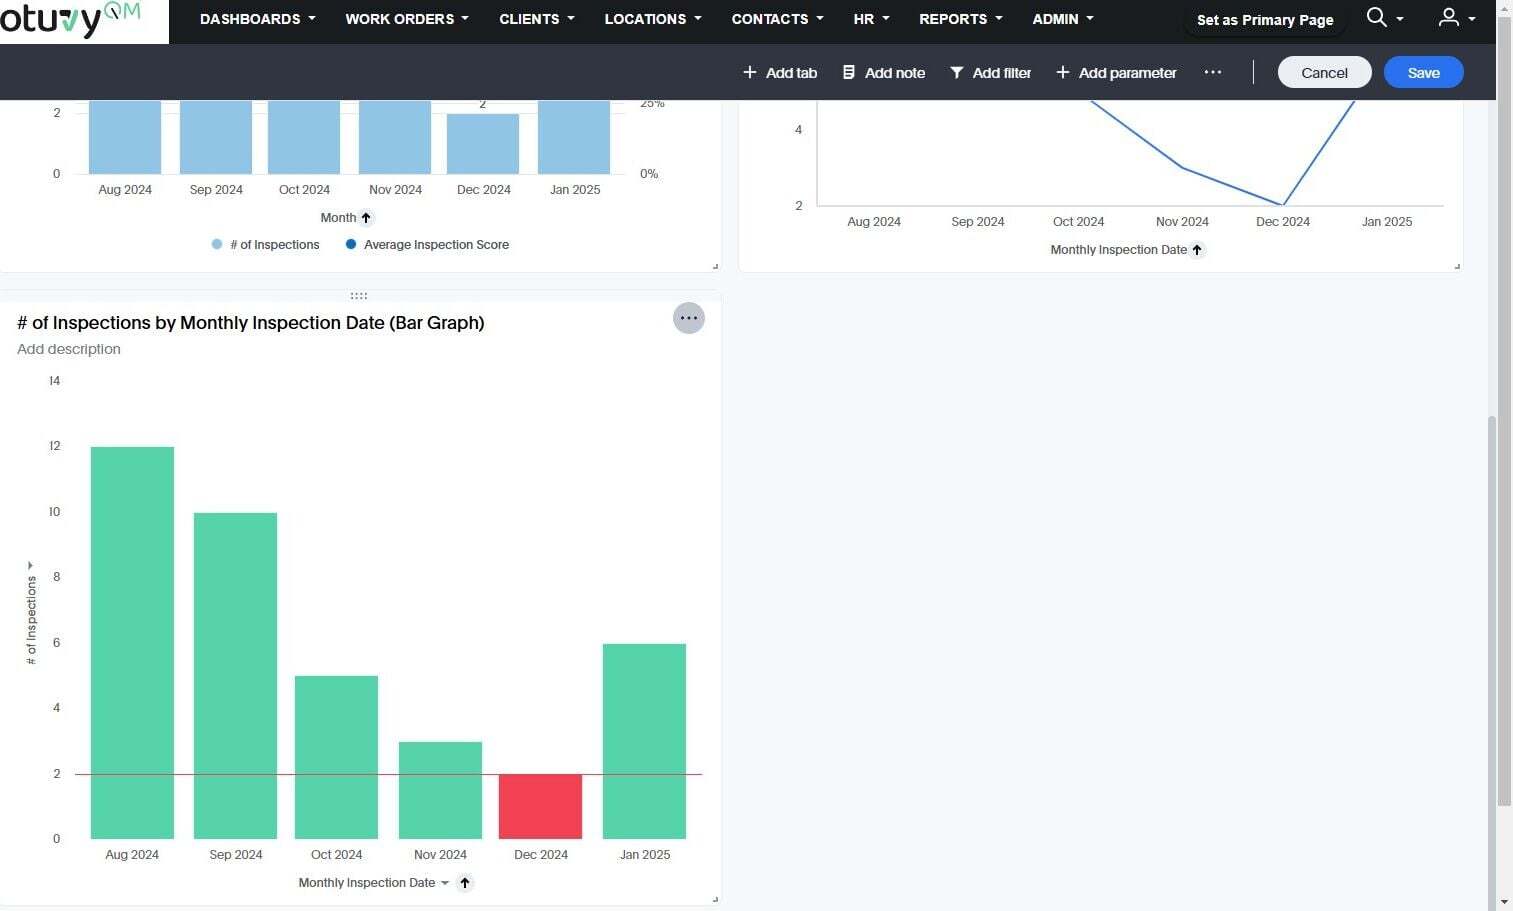
Find the dashlet you want to resize, hover your cursor over it and click this icon in the top-right corner of the dashlet
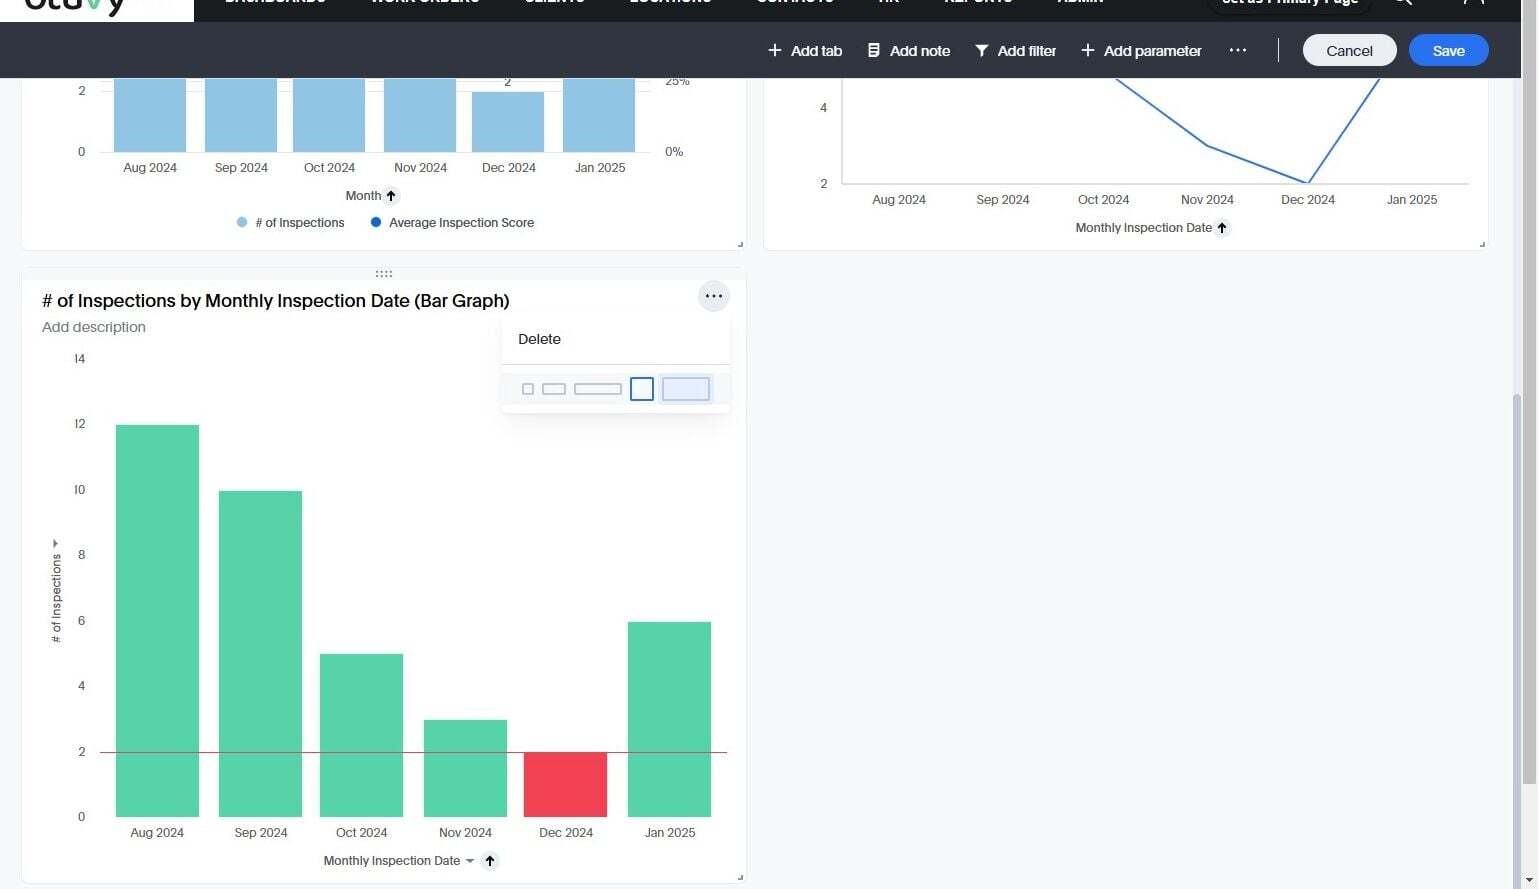
These are some pre-defined sizes available to you
You can also drag from the bottom corner of the dashlet to resize it to a custom dimension
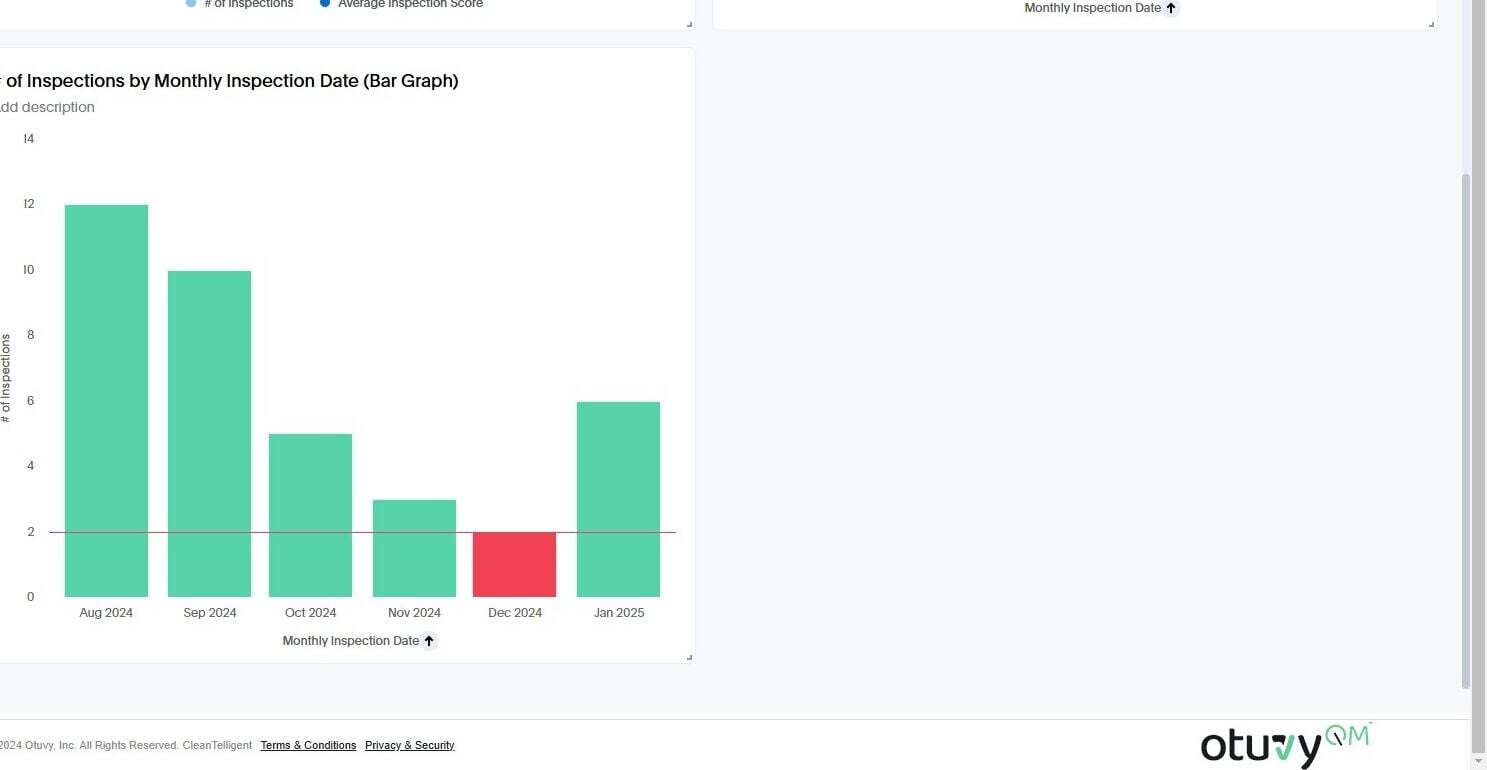
You can drag a dashlet to move it around on the dashboard while in edit mode. Drag while holding the top of the dashlet to move it around.
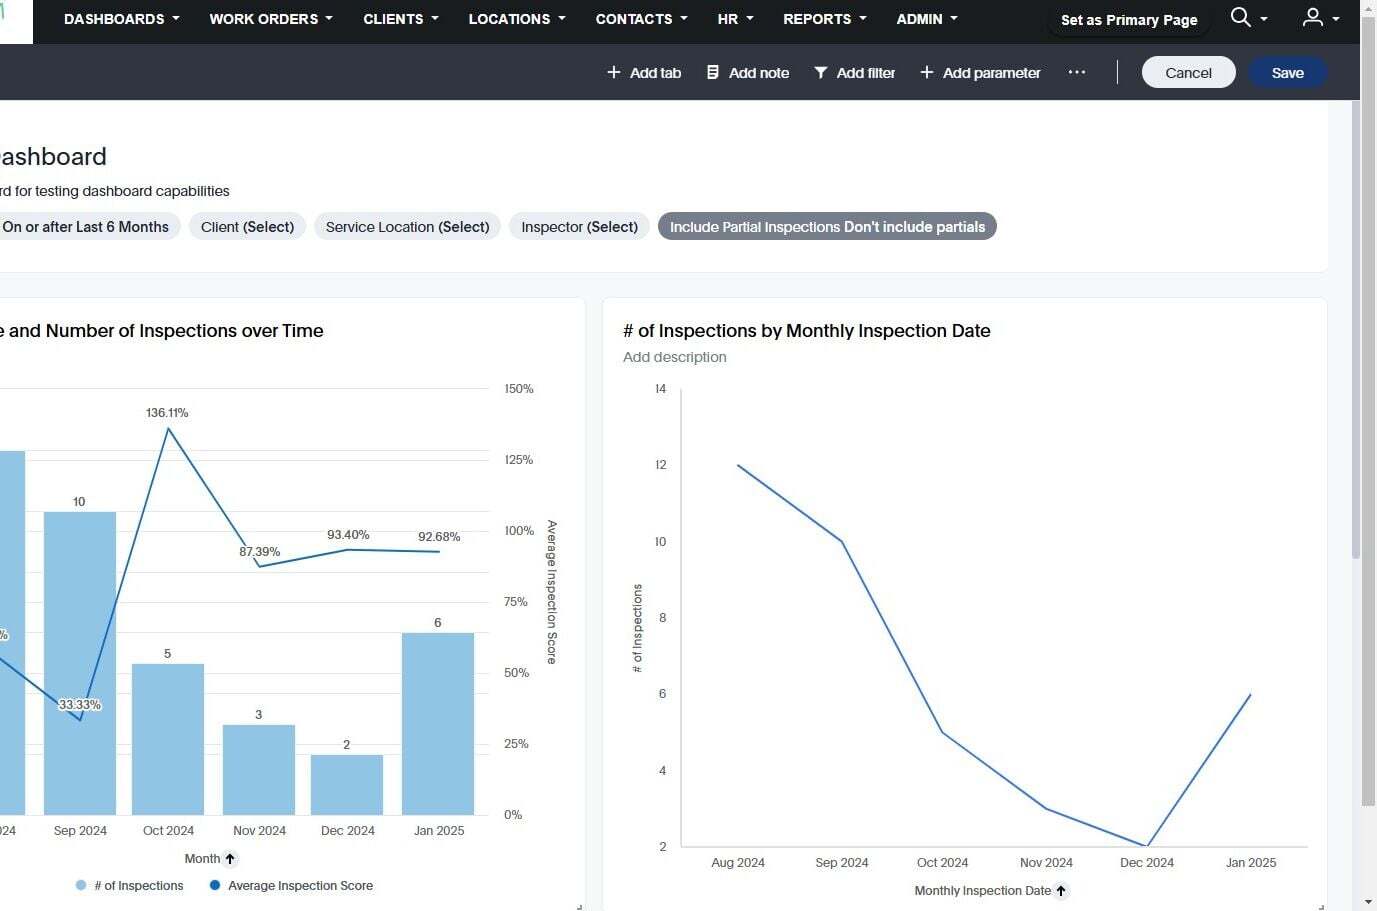
Once everything looks correct, click "Save" to save the changes
- [Otuvy QM - Getting Started](https://help.otuvy.com/kb/otuvy-qm-getting-started?hsLang=en)
- [Otuvy QM - Setup & Administration](https://help.otuvy.com/kb/otuvy-qm-setup-administration?hsLang=en)
- [Otuvy QM - Contact Access](https://help.otuvy.com/kb/otuvy-qm-contact-access?hsLang=en)
- [Otuvy QM - Inspections](https://help.otuvy.com/kb/otuvy-qm-inspections?hsLang=en)
- [Otuvy QM - Work Orders](https://help.otuvy.com/kb/otuvy-qm-work-orders?hsLang=en)
- [Otuvy QM - Mobile App](https://help.otuvy.com/kb/otuvy-qm-mobile-app?hsLang=en)
- [Otuvy QM - Reports & Dashboards](https://help.otuvy.com/kb/otuvy-qm-reports-dashboards?hsLang=en)
- [Otuvy QM - Advanced Features](https://help.otuvy.com/kb/otuvy-qm-advanced-features?hsLang=en)
- [Otuvy Frontline](https://help.otuvy.com/kb/otuvy-frontline?hsLang=en#main-content)
- [Getting Started](https://help.otuvy.com/kb/otuvy-frontline?hsLang=en#getting-started)
- [Mobile App](https://help.otuvy.com/kb/otuvy-frontline?hsLang=en#mobile-app)
- [Admin Portal](https://help.otuvy.com/kb/otuvy-frontline?hsLang=en#admin-portal)
- [Uncategorized](https://help.otuvy.com/kb/uncategorized?hsLang=en)
[](https://www.otuvy.com/)
[mailto:email@email.com](mailto:email@email.com)
Copyright © 2026, Otuvy, Inc.