Using OI Dashboards Ask AI Function
Otuvy Operational Intelligence (OI) Dashboards provide OI Platinum users with advanced data visualization and AI-driven insights. This guide walks you through navigating your dashboard, using AI-powered queries, and pinning custom dashlets. Learn how to access key operational intelligence tools to streamline analysis and enhance decision-making.
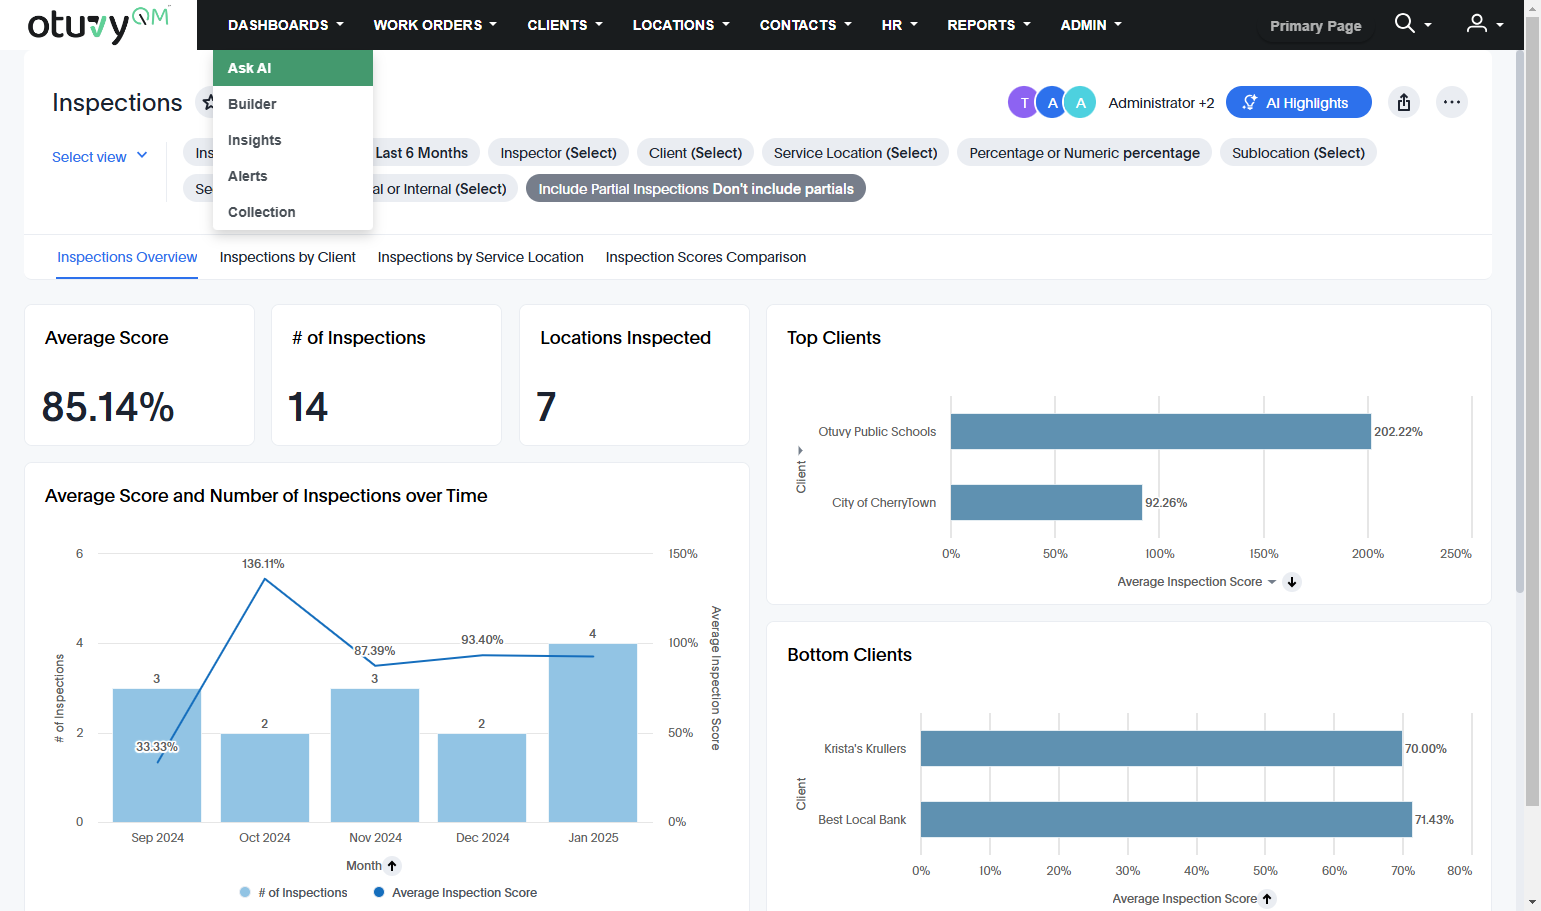
1. Click on Ask AI to navigate to the tool
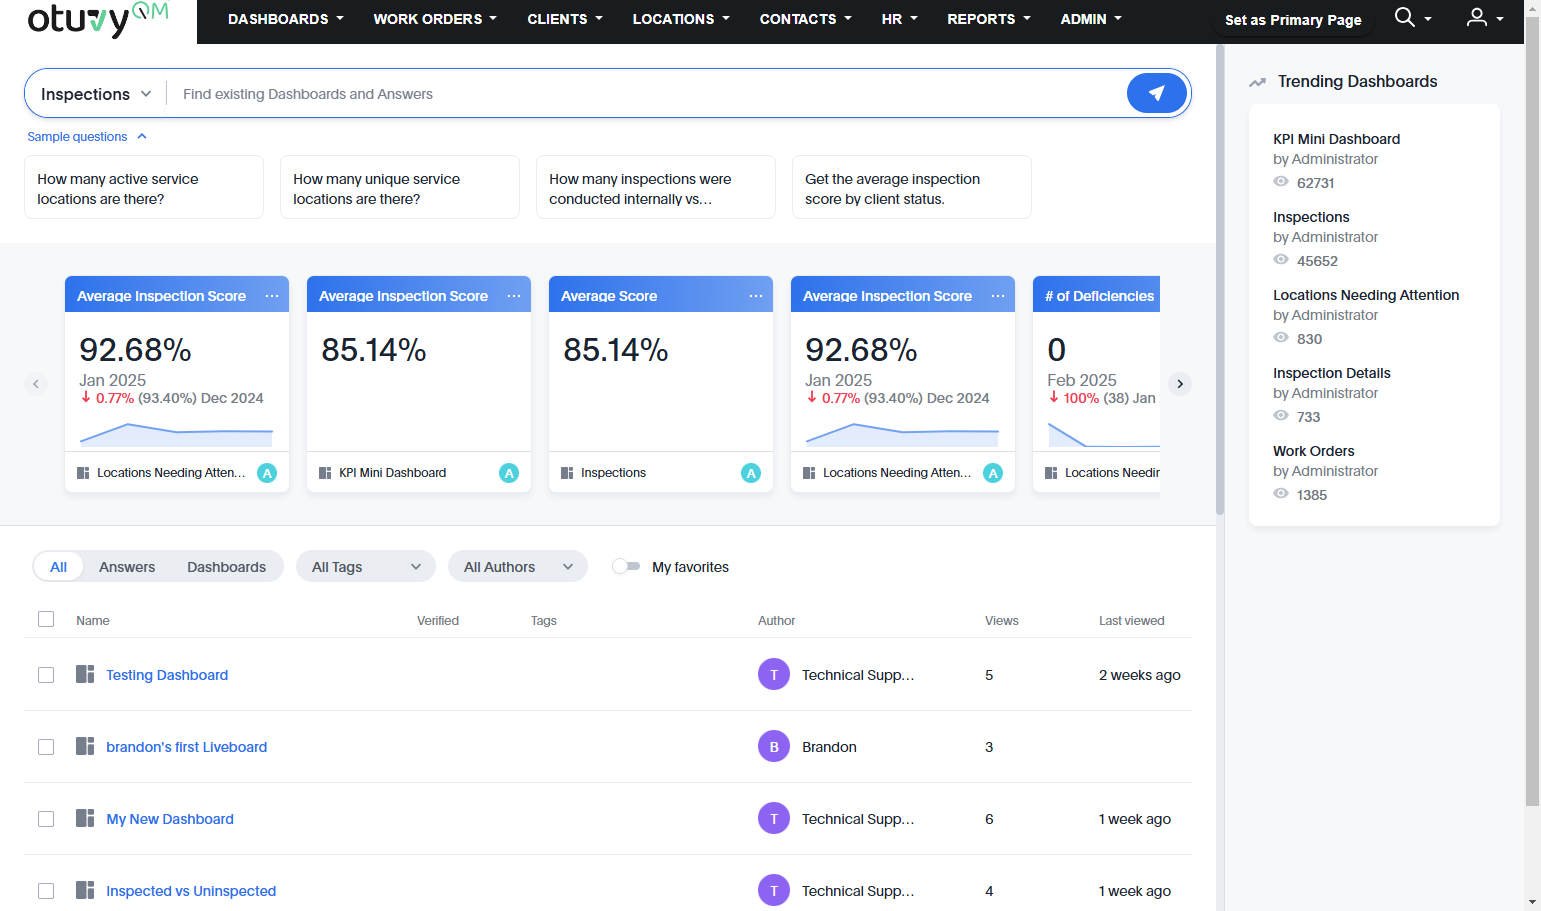
2. There are several sample questions you can select from
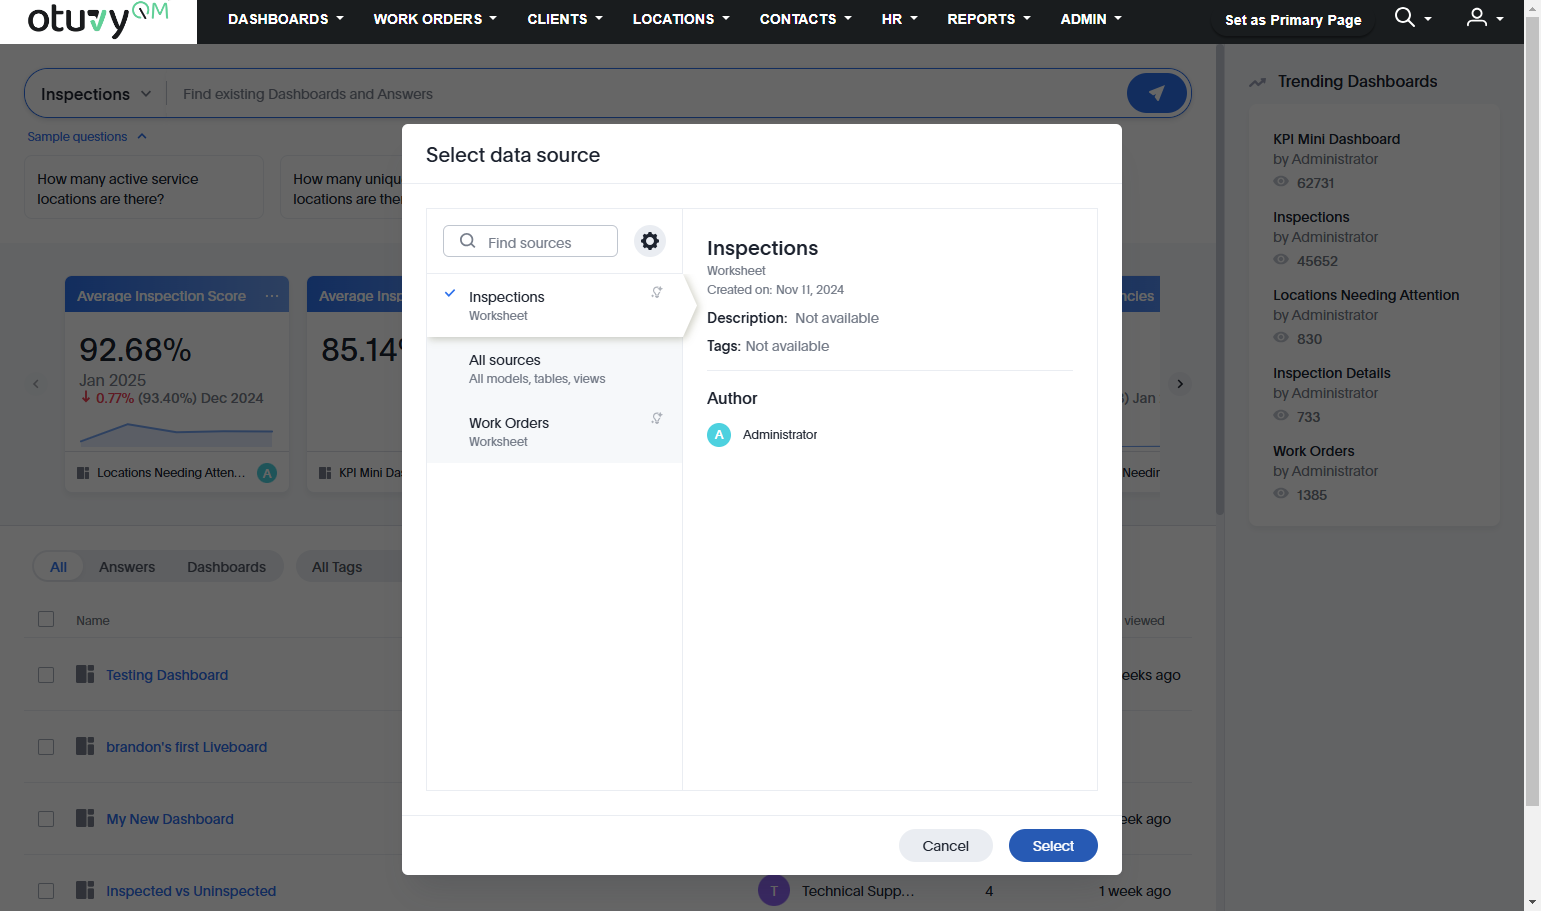
3. Select the Data Set
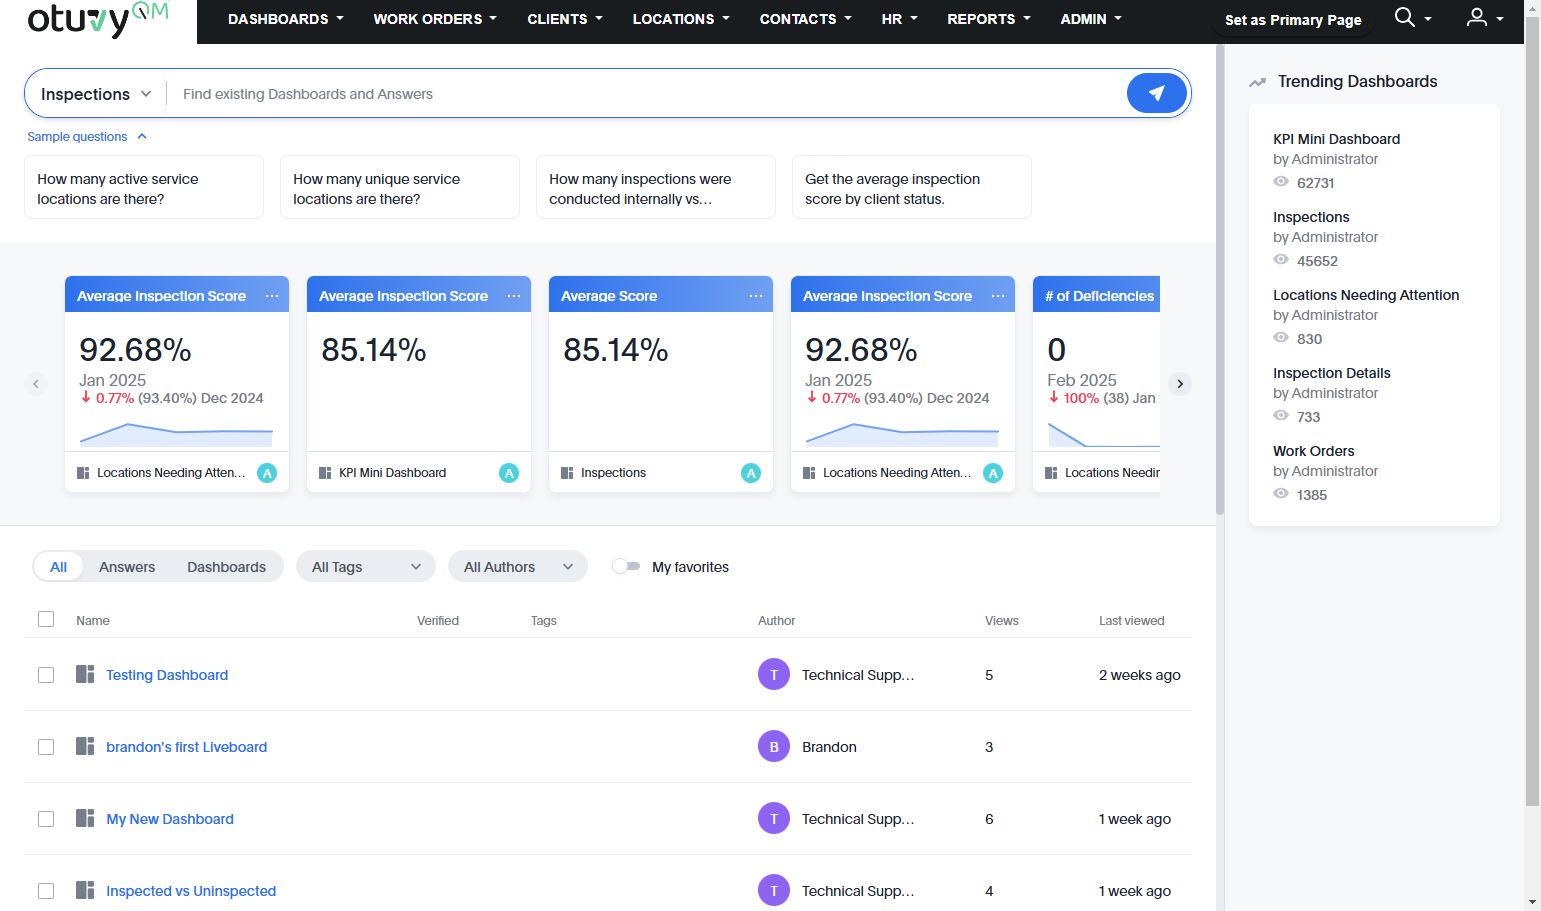
There are two data sets to choose from; Inspections and Work Orders. Switch to the dataset you want to ask about by clicking this selector.
4. Select the data source you want
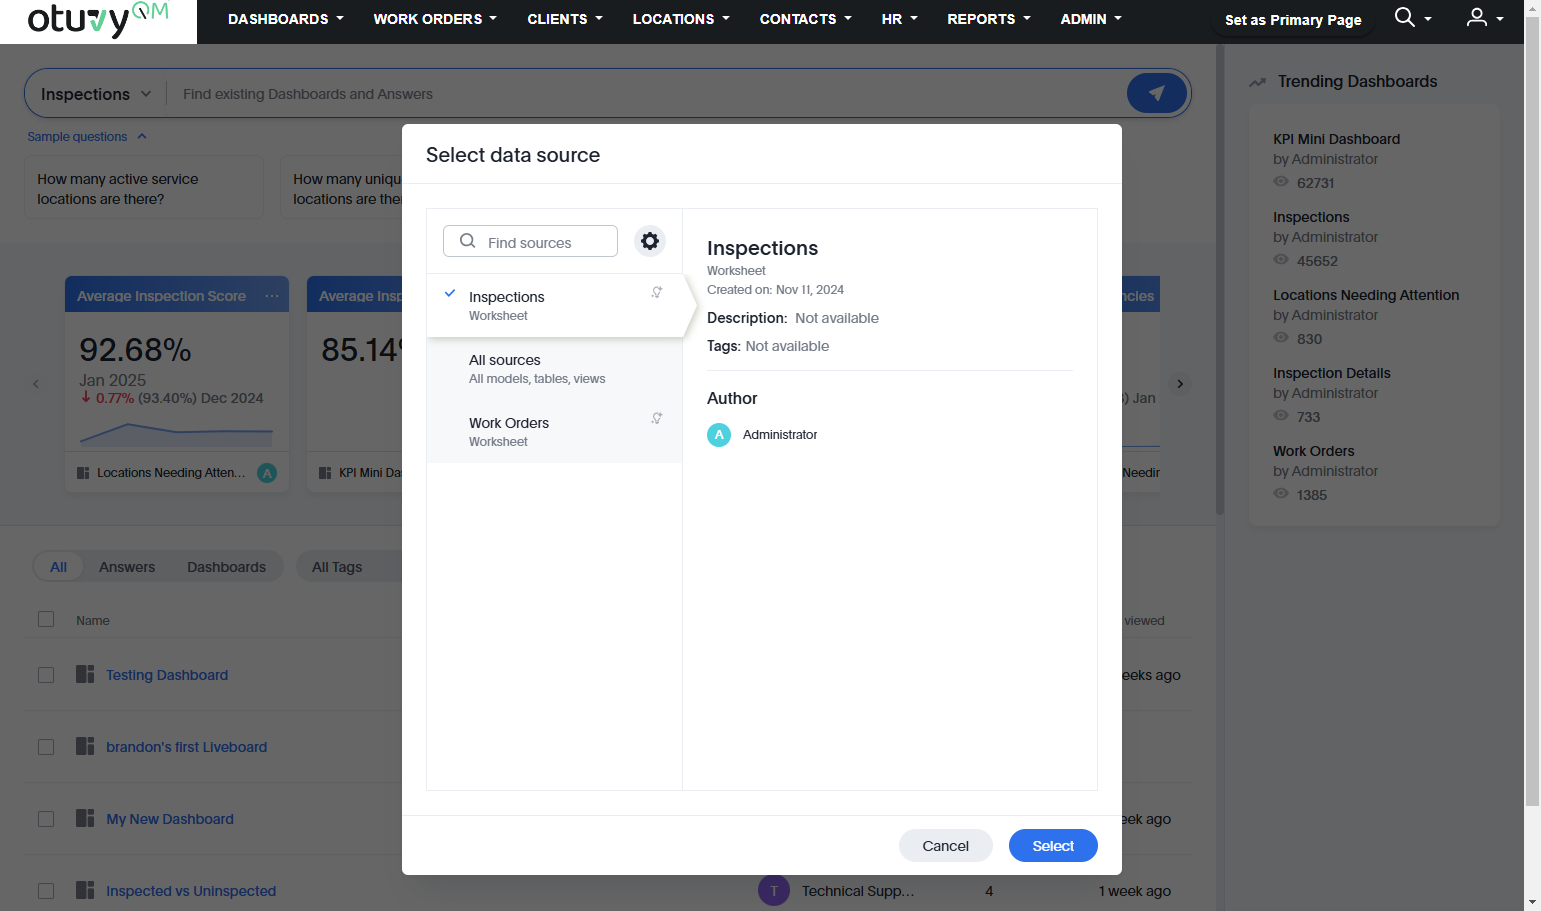
5. and then Click on Select
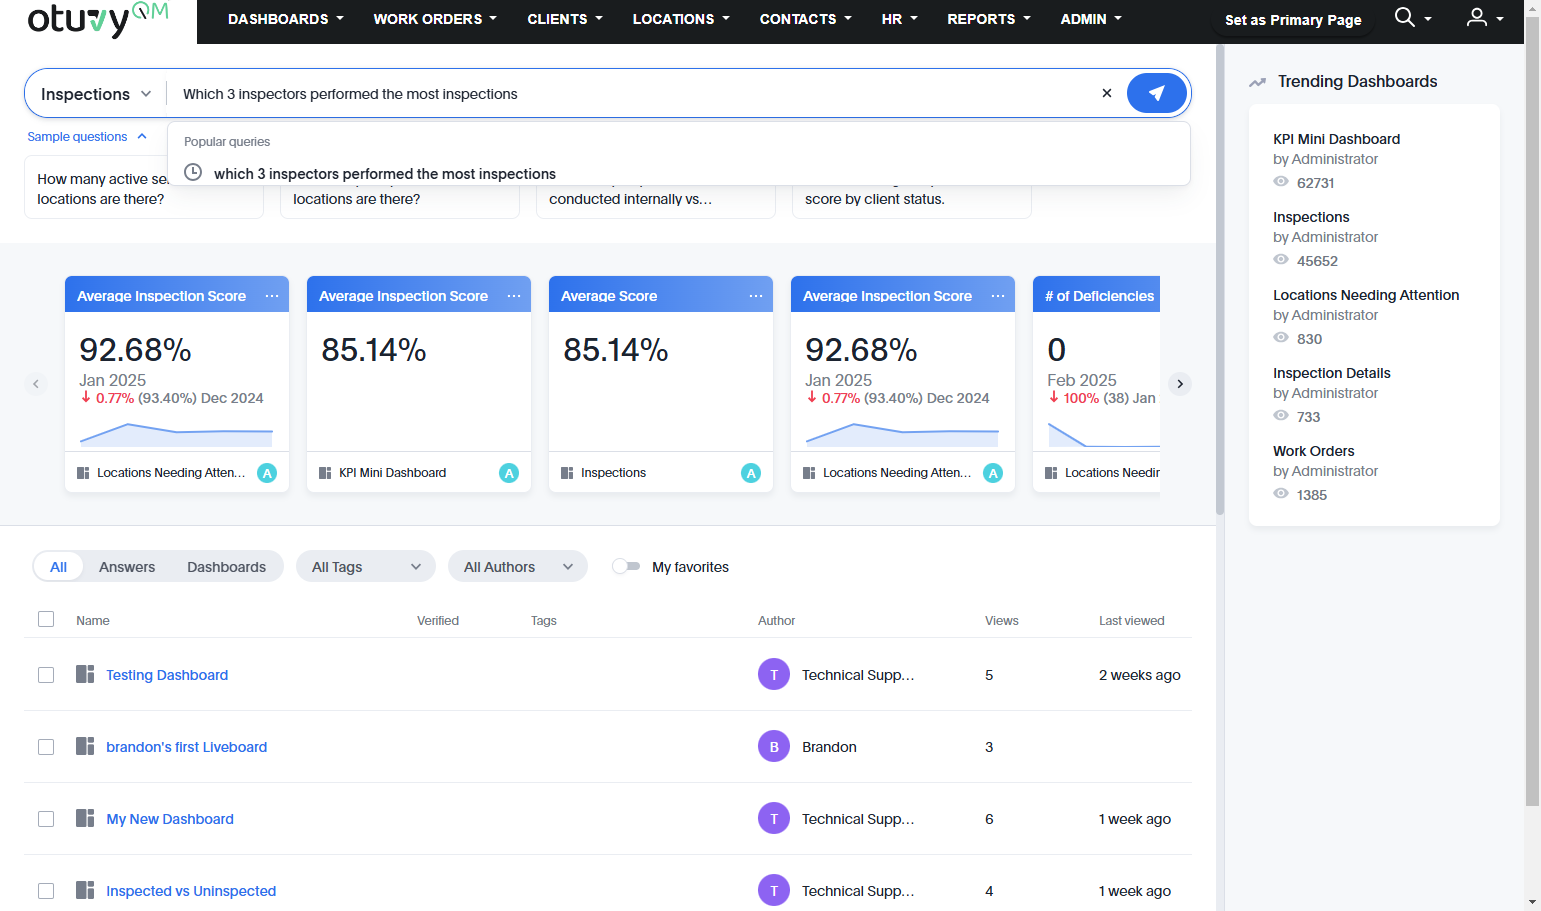
6. Ask a Question
Now you can ask your question, like "Which 3 inspectors performed the most inspections" then click on Search to the right.
7. Error Handling
If your question was vague, you may get a similar error saying, "Part of your question was omitted. Refine if results don't match expectations." Review the data output to see if your information is what you expected.
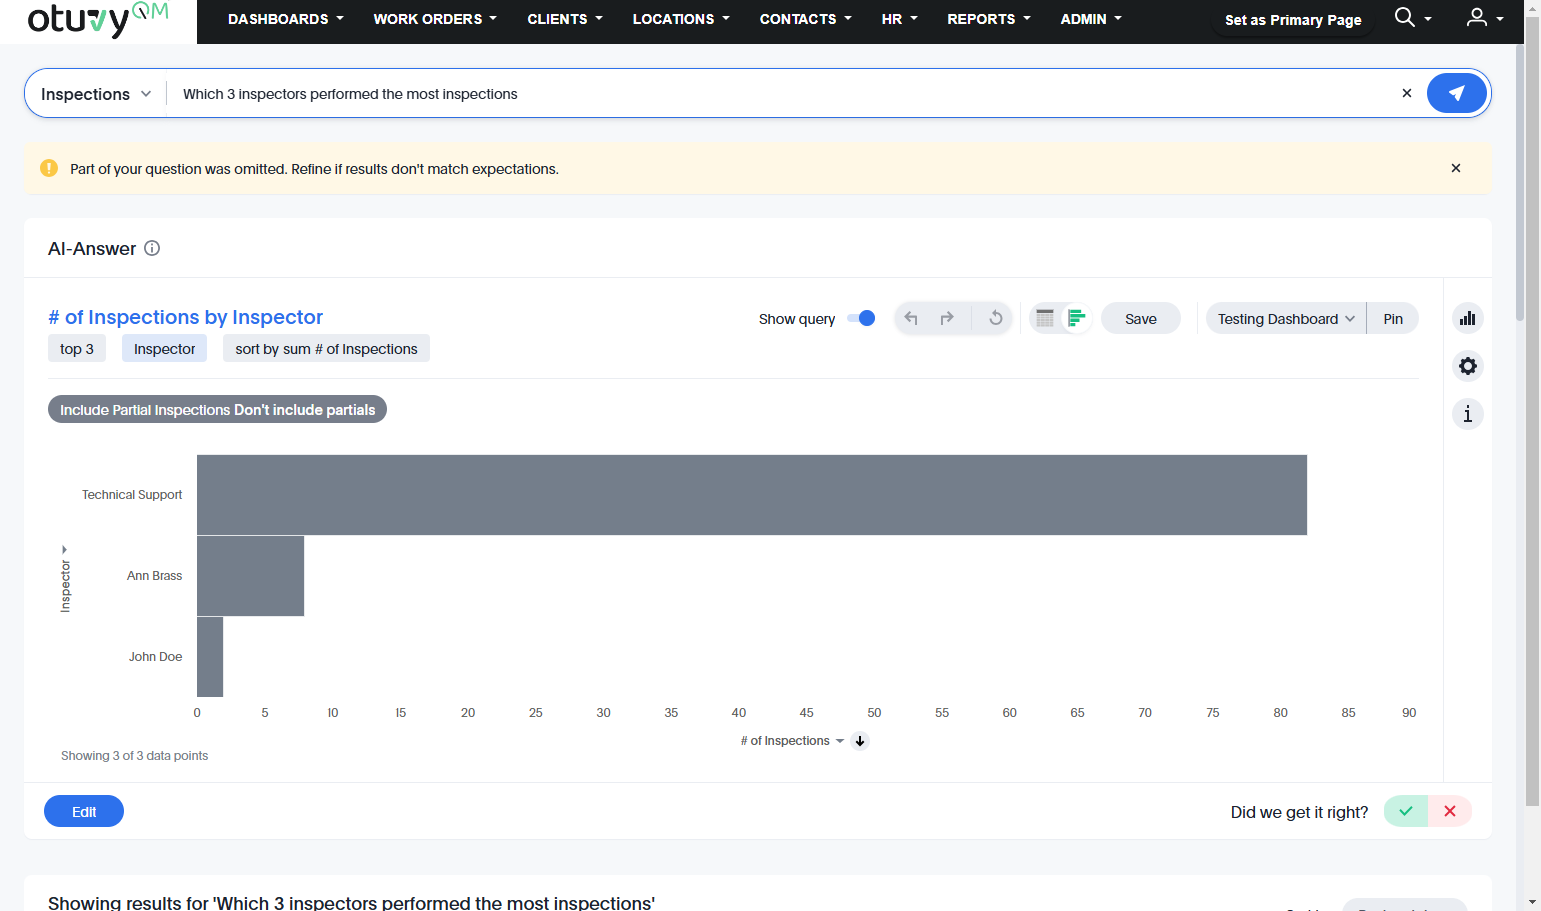
8. Review the Data
This is the data which the AI has prepared for you. Look it over to see if it looks the way you expected.
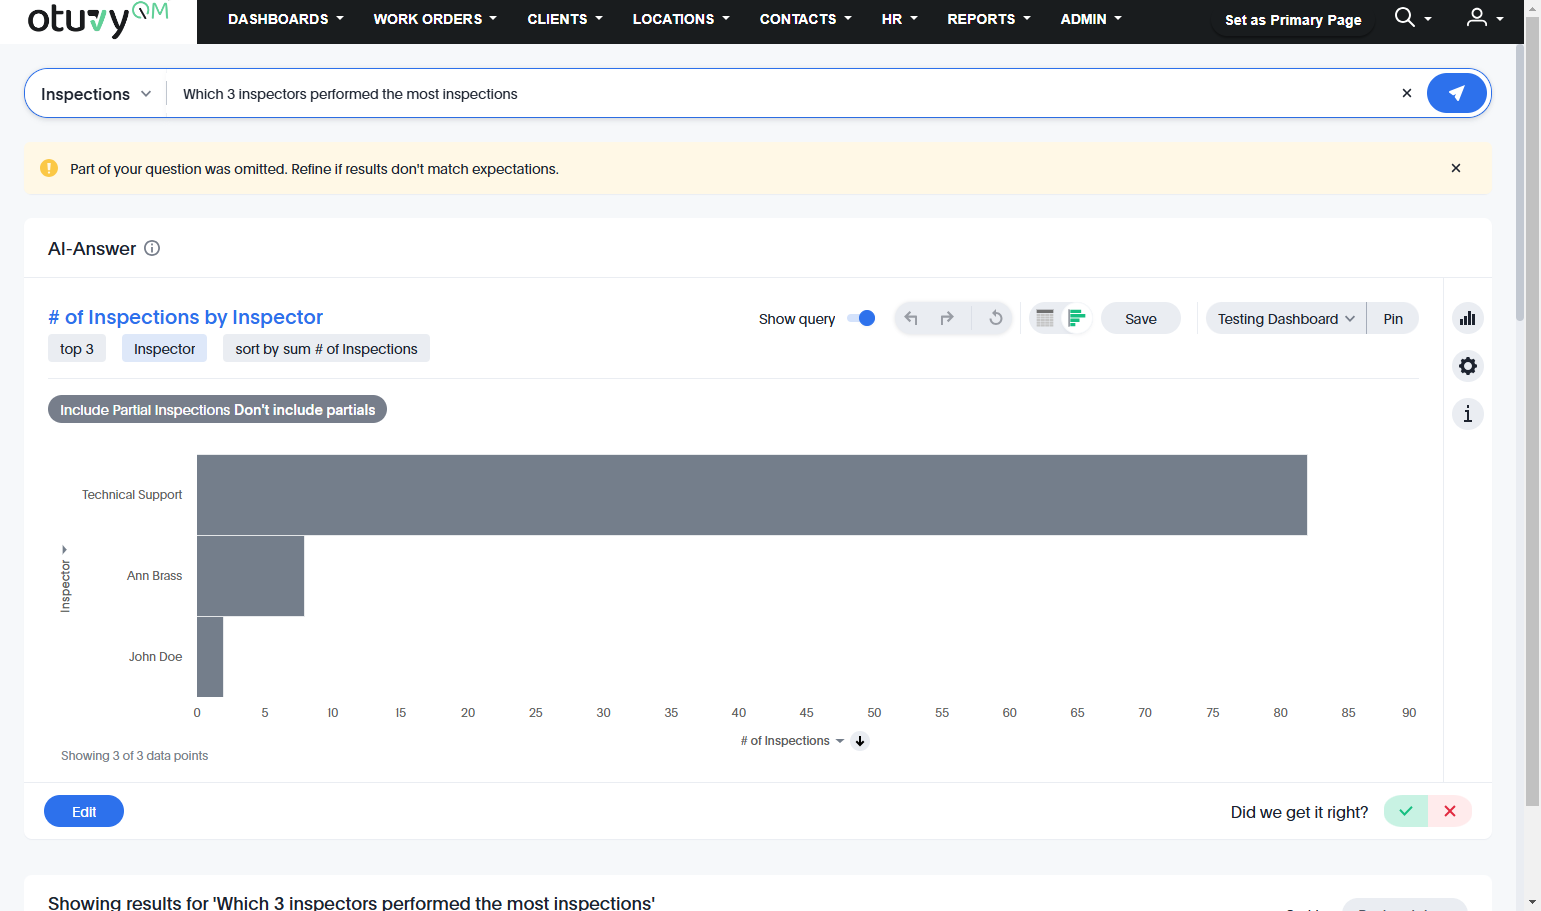
9. Provide Feedback
If the data returned doesn't look right, click the X next to "Did we get it right?"
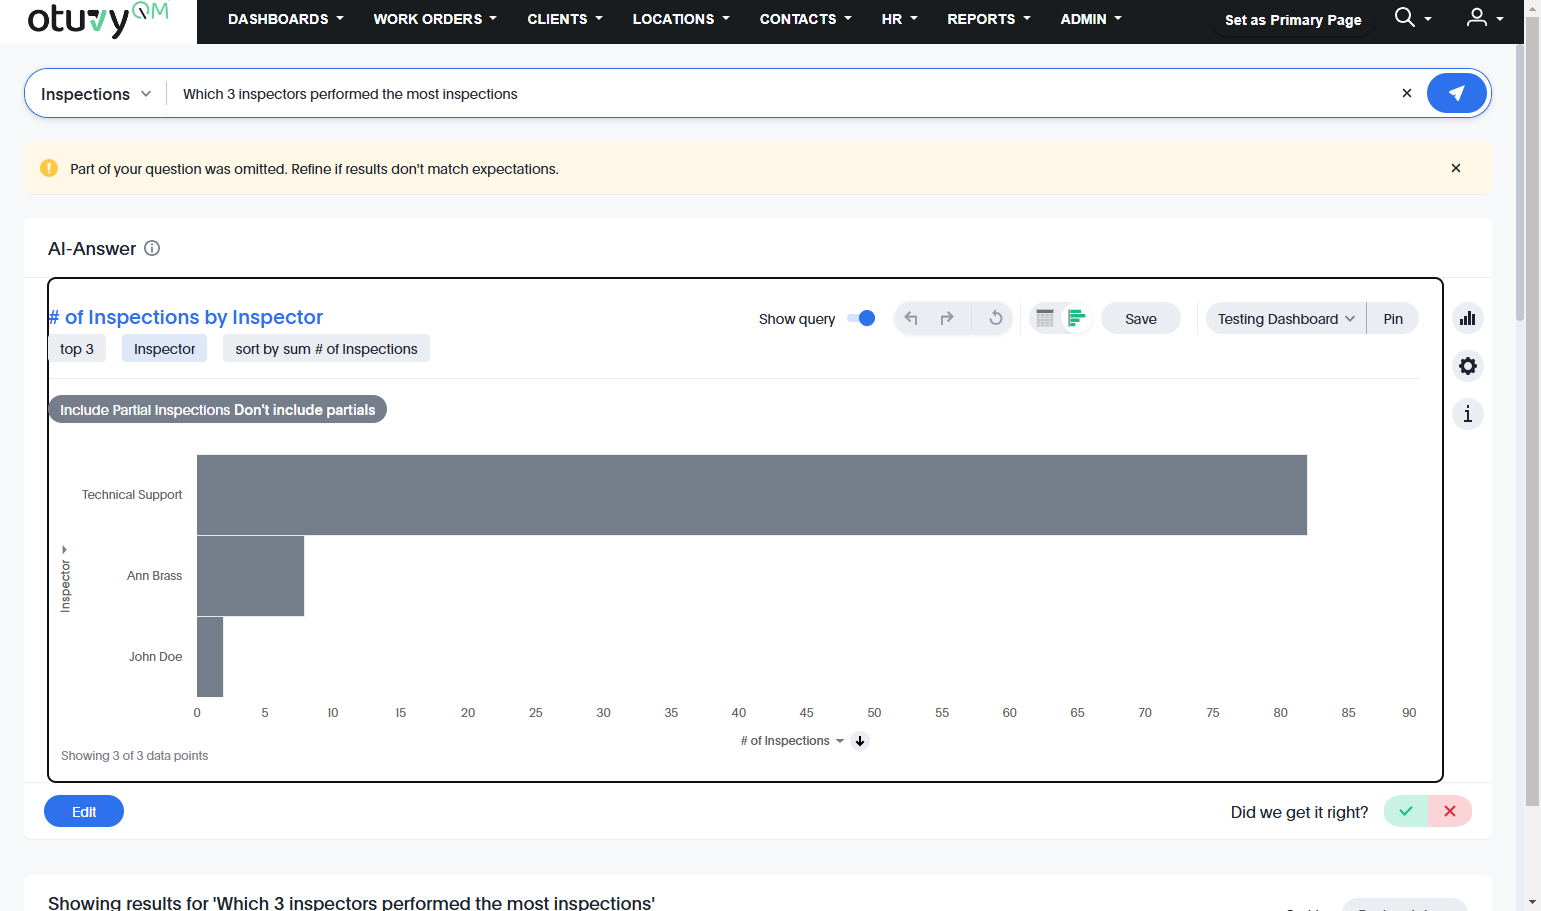
10. Train the AI
Since you provided feedback that the AI didn't get it right, a new option appeared. To train the AI, click "Not satisfied? Let's fix it"
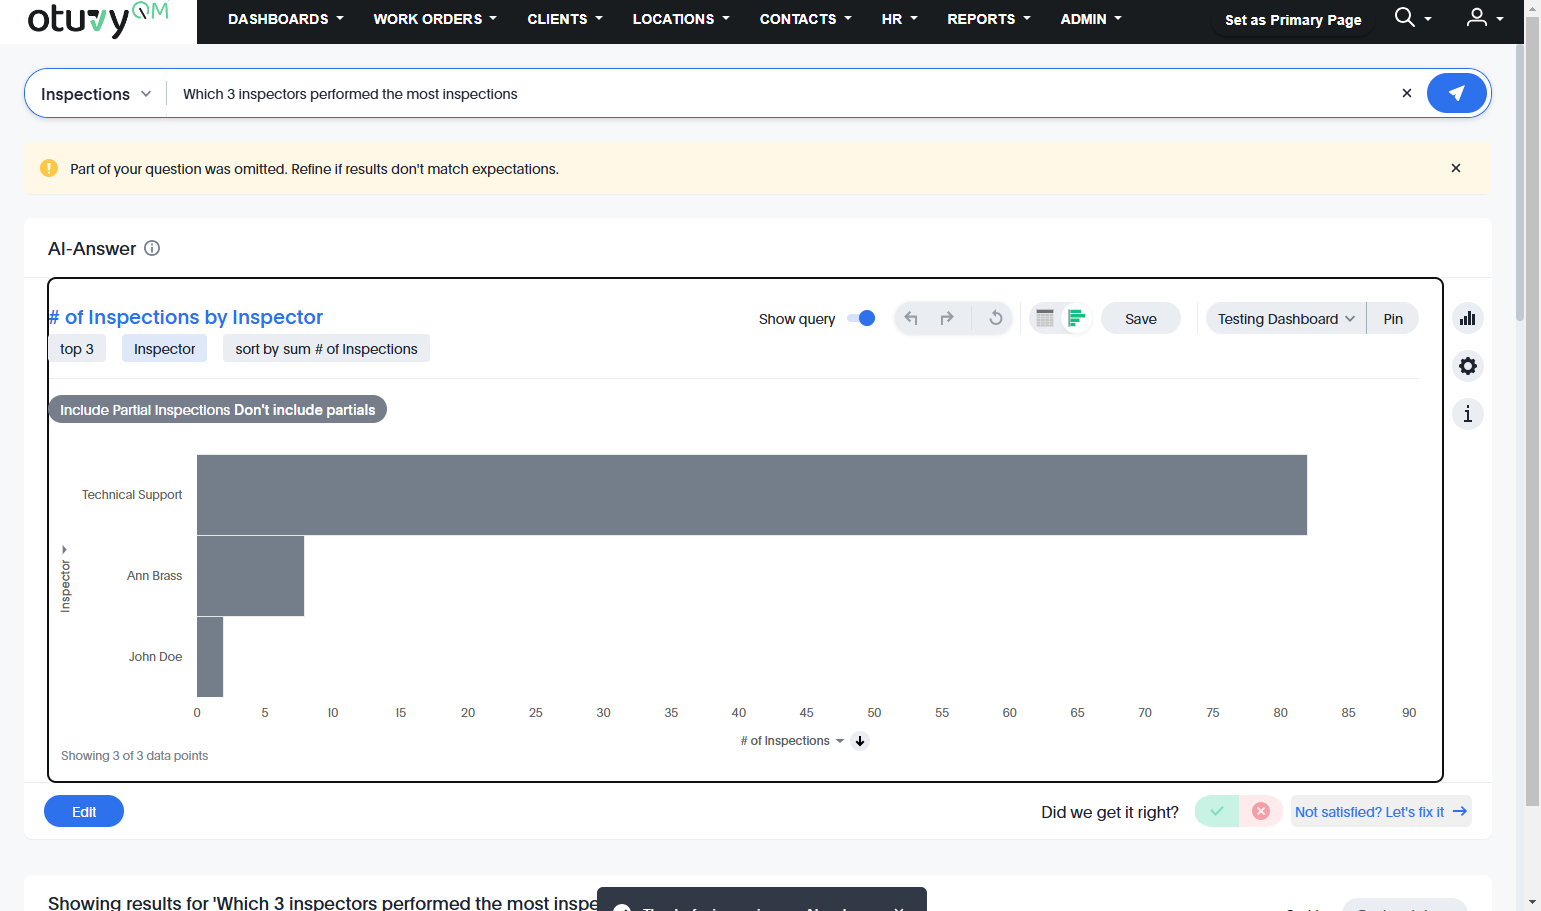
11. Select Measures, Attributes, and Dates
Now you can scroll through the measures, attributes, and dates that are available to select them as needed.
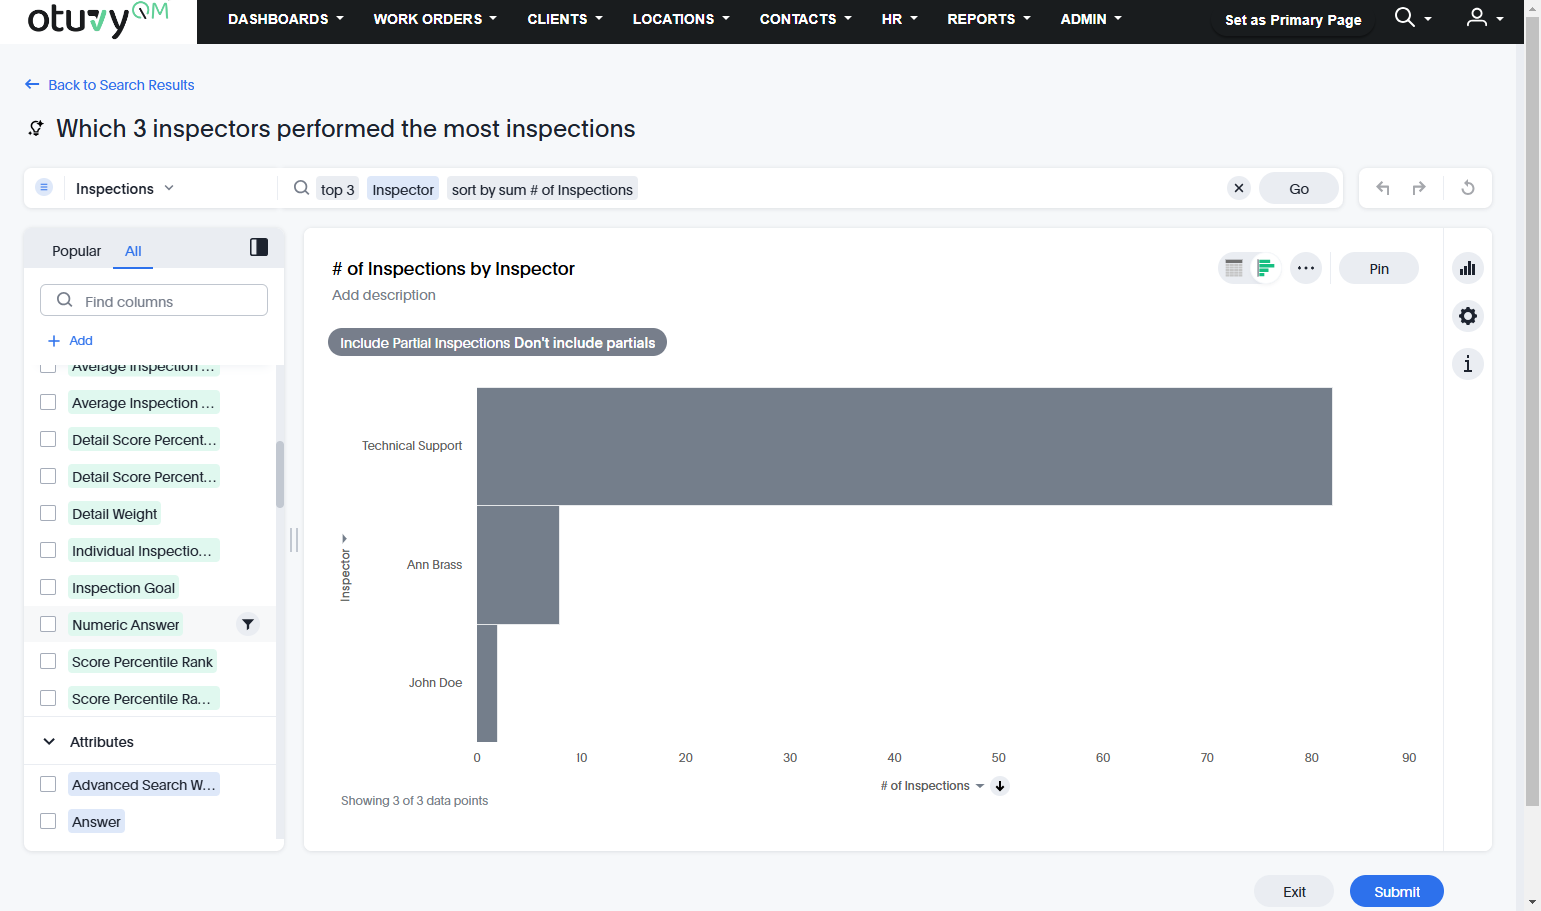
12. Add Measures, Attributes, Dates, and Filters
Either by selecting them from the left or typing them in the query bar, adjust the measures, attributes, dates, and filters until all the data you need is represented
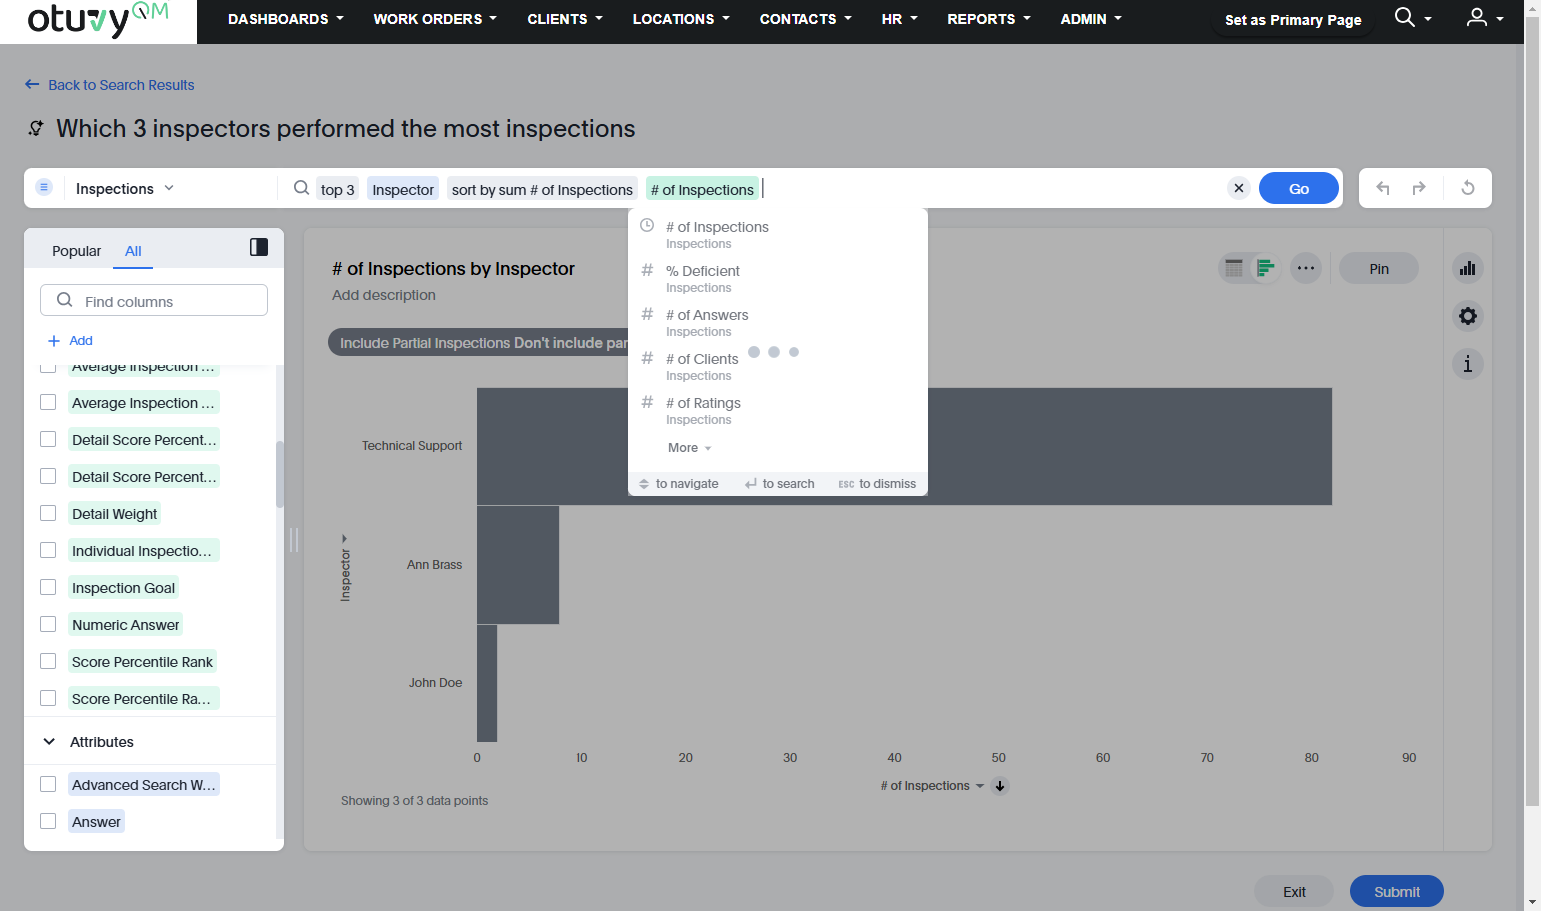
13. Click on Go
Be sure to click on Go to see the changes to the query represented in the chart
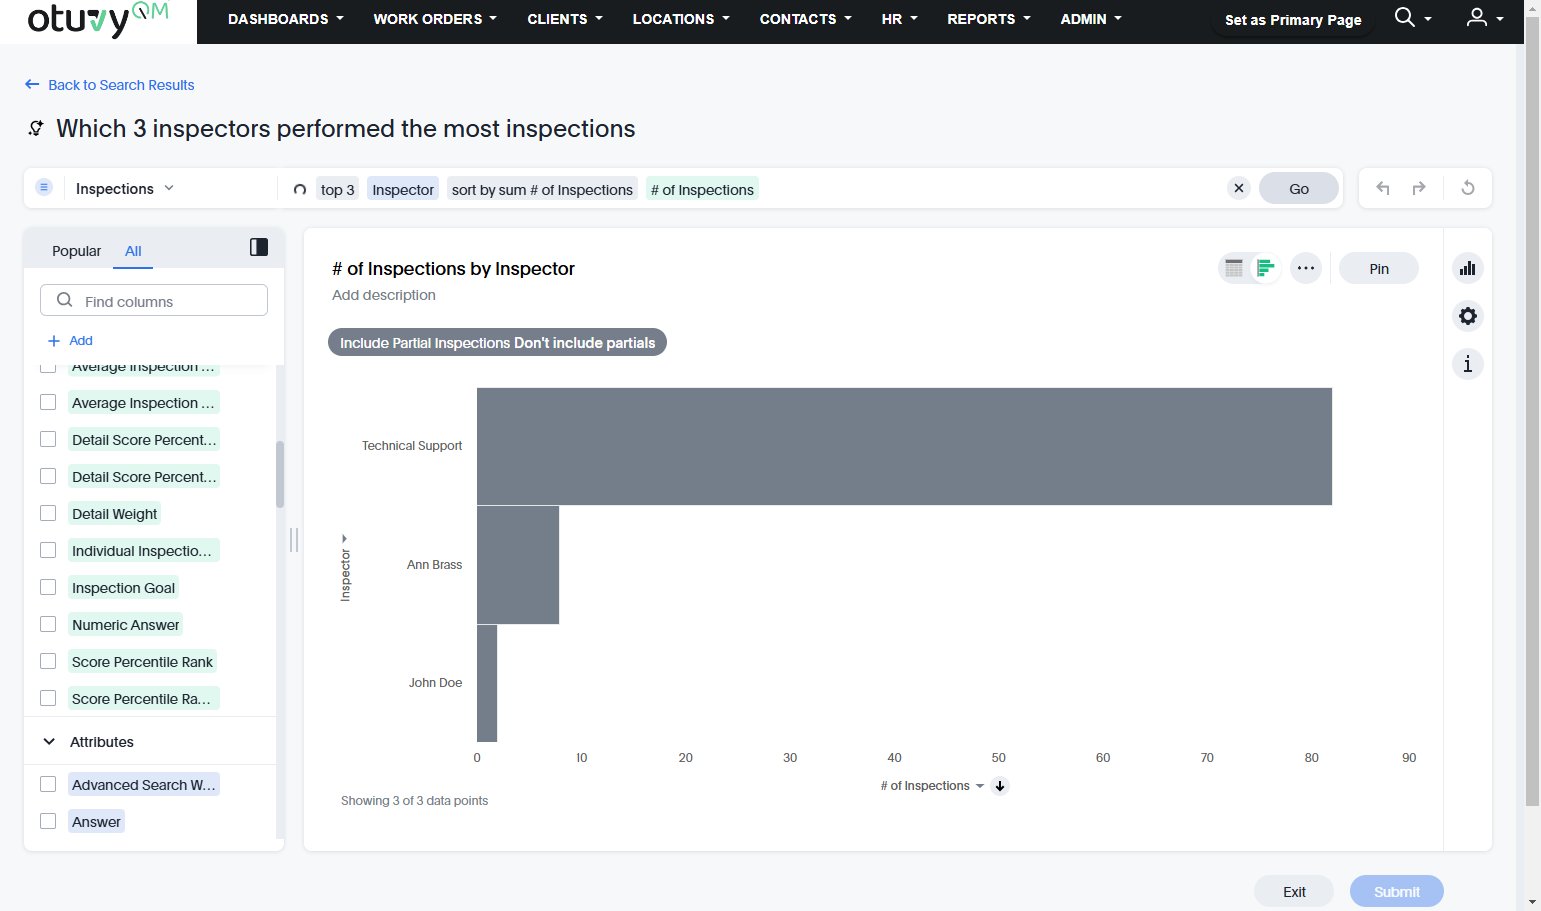
14. Change the visualization
Click on the "Change visualization" button to select a different chart style if desired
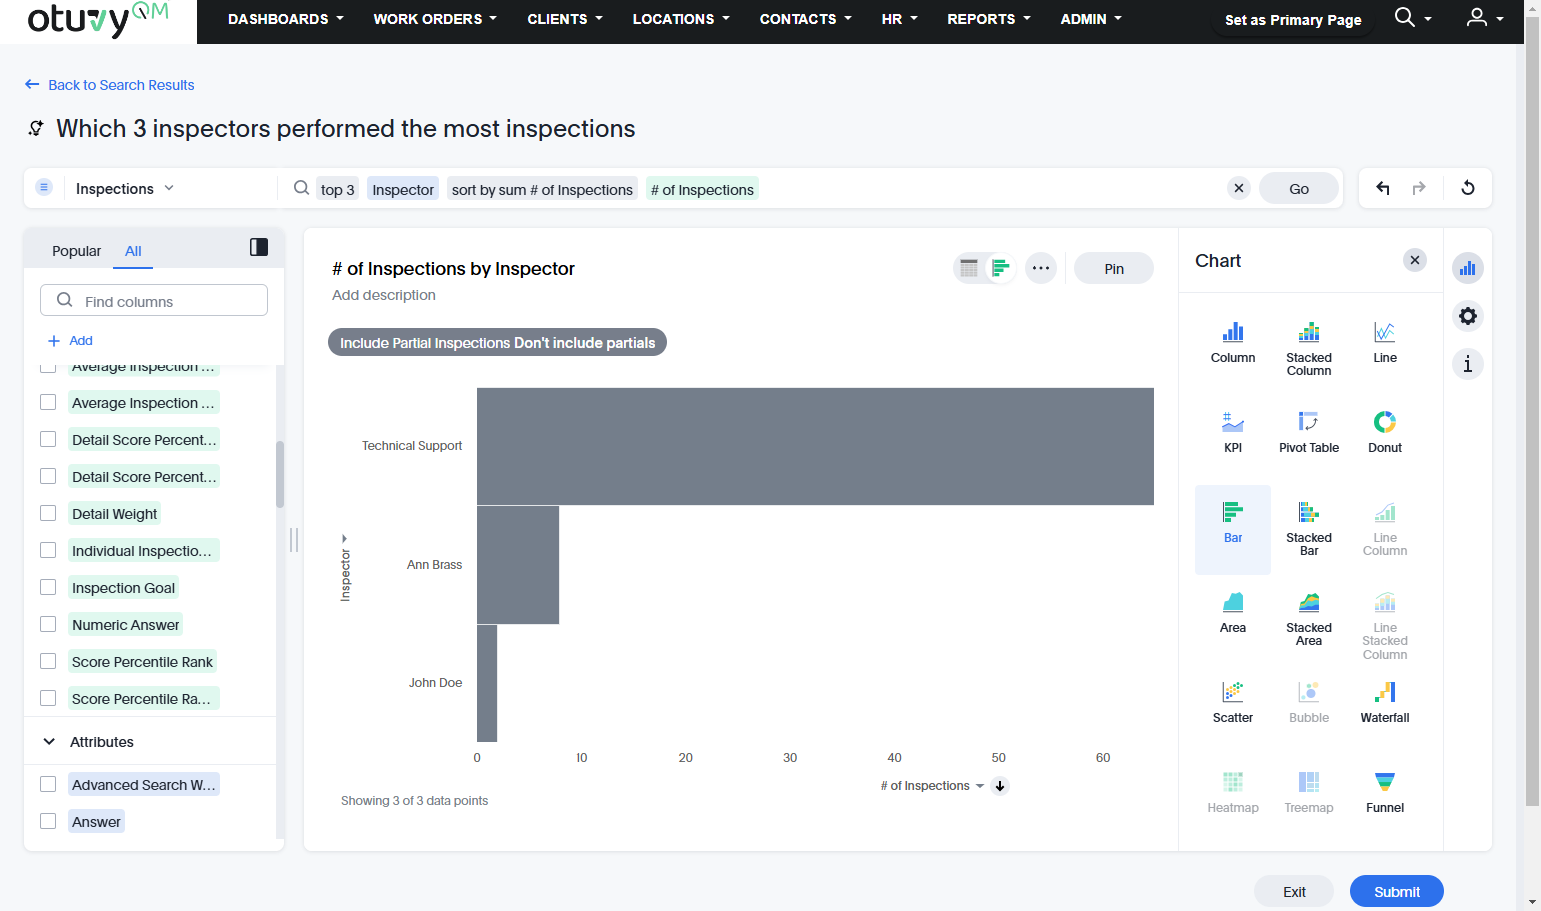
15. Edit the chart configuration
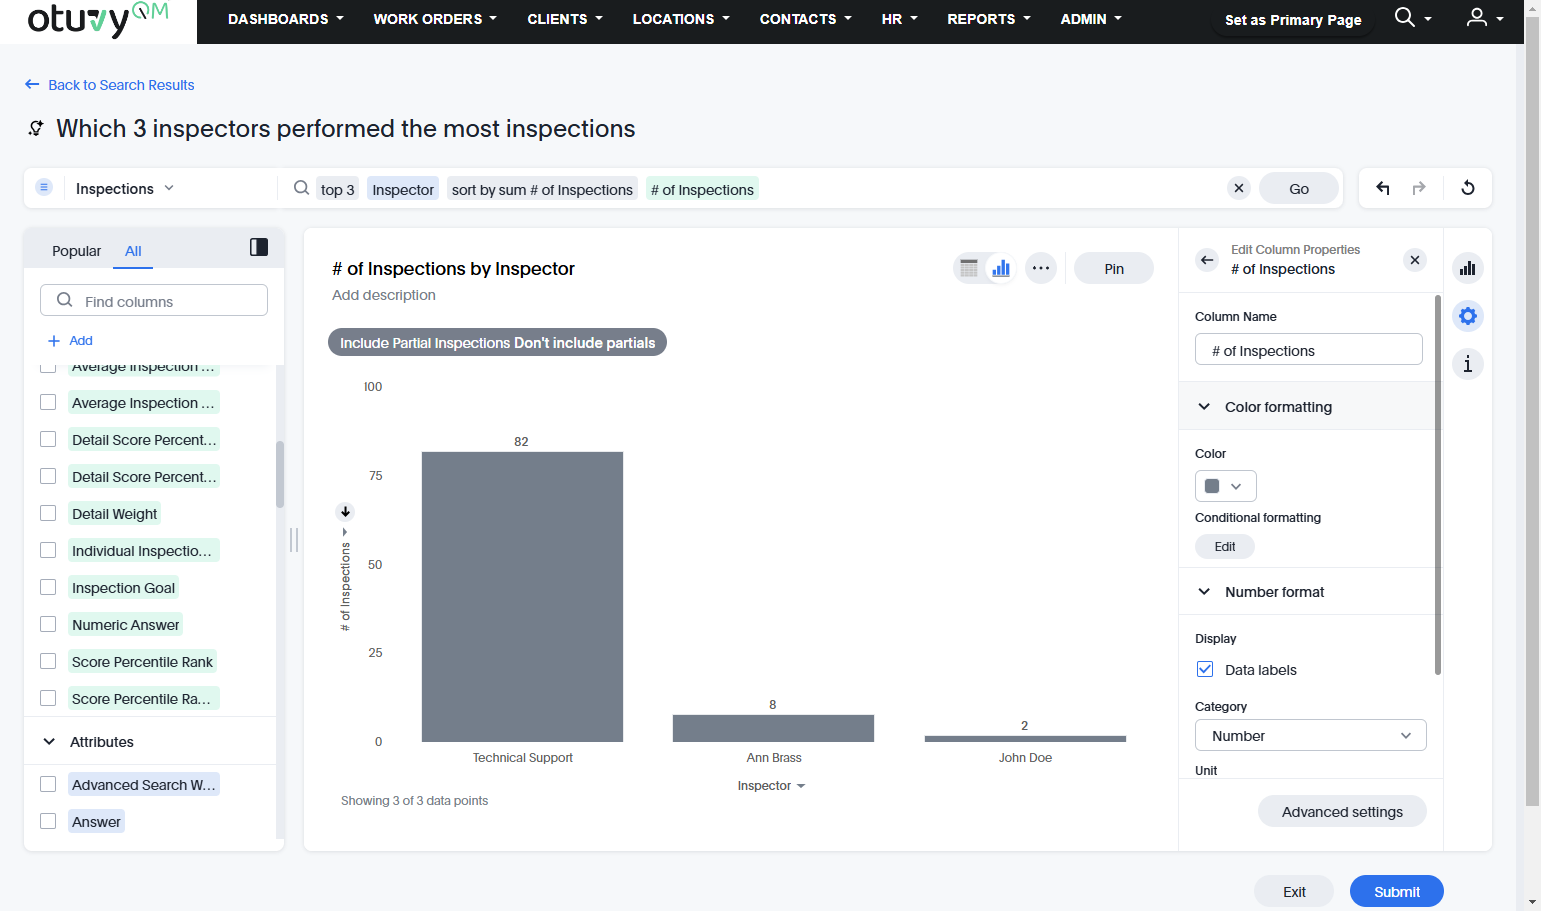
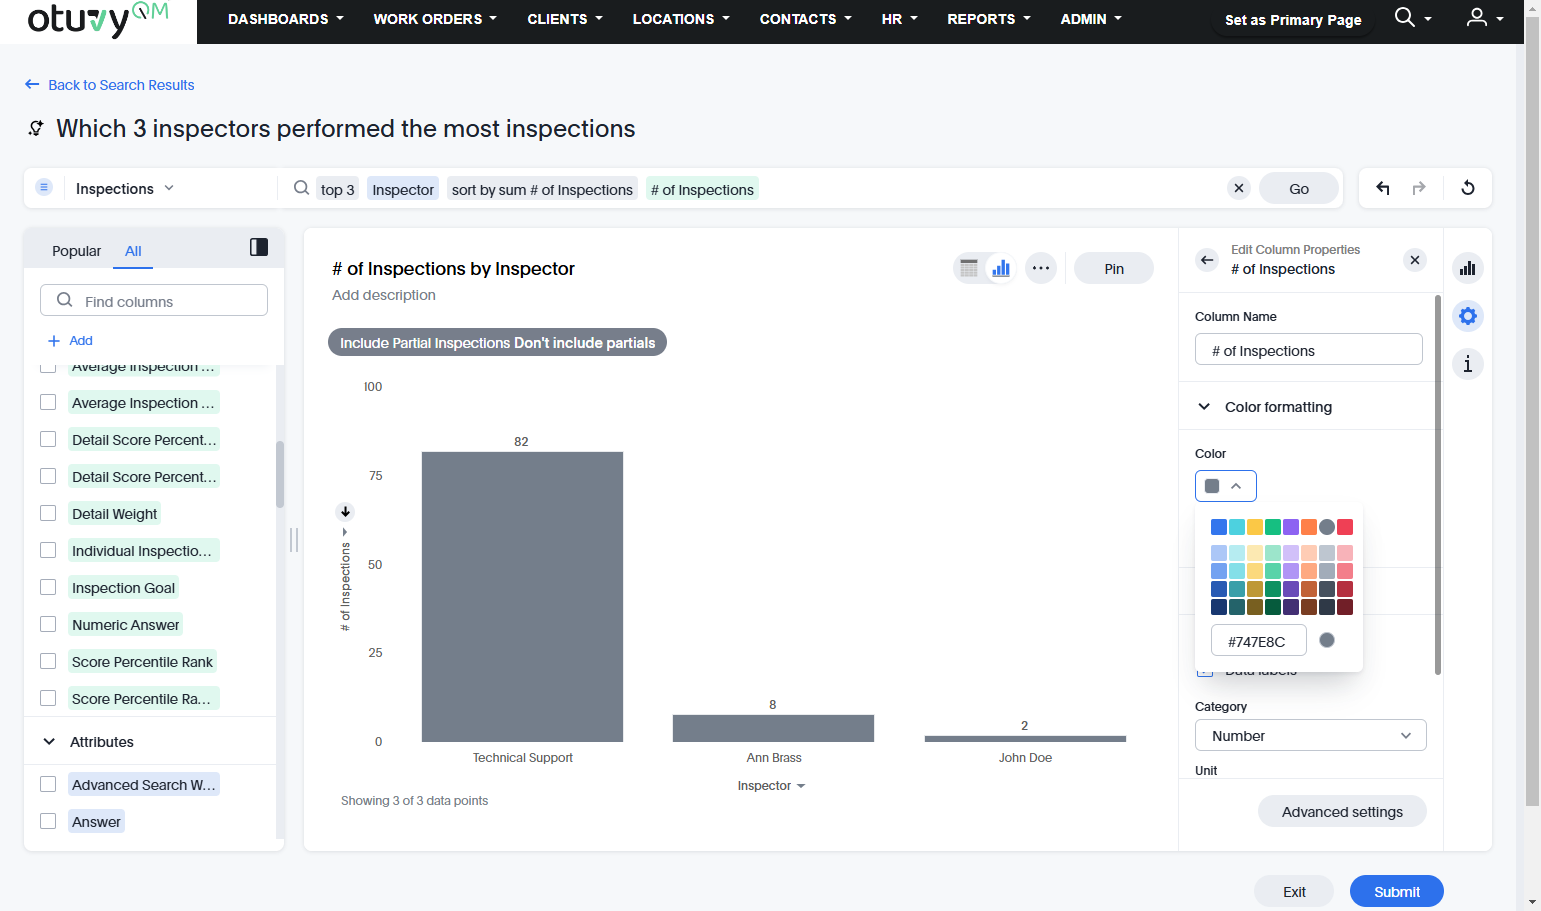
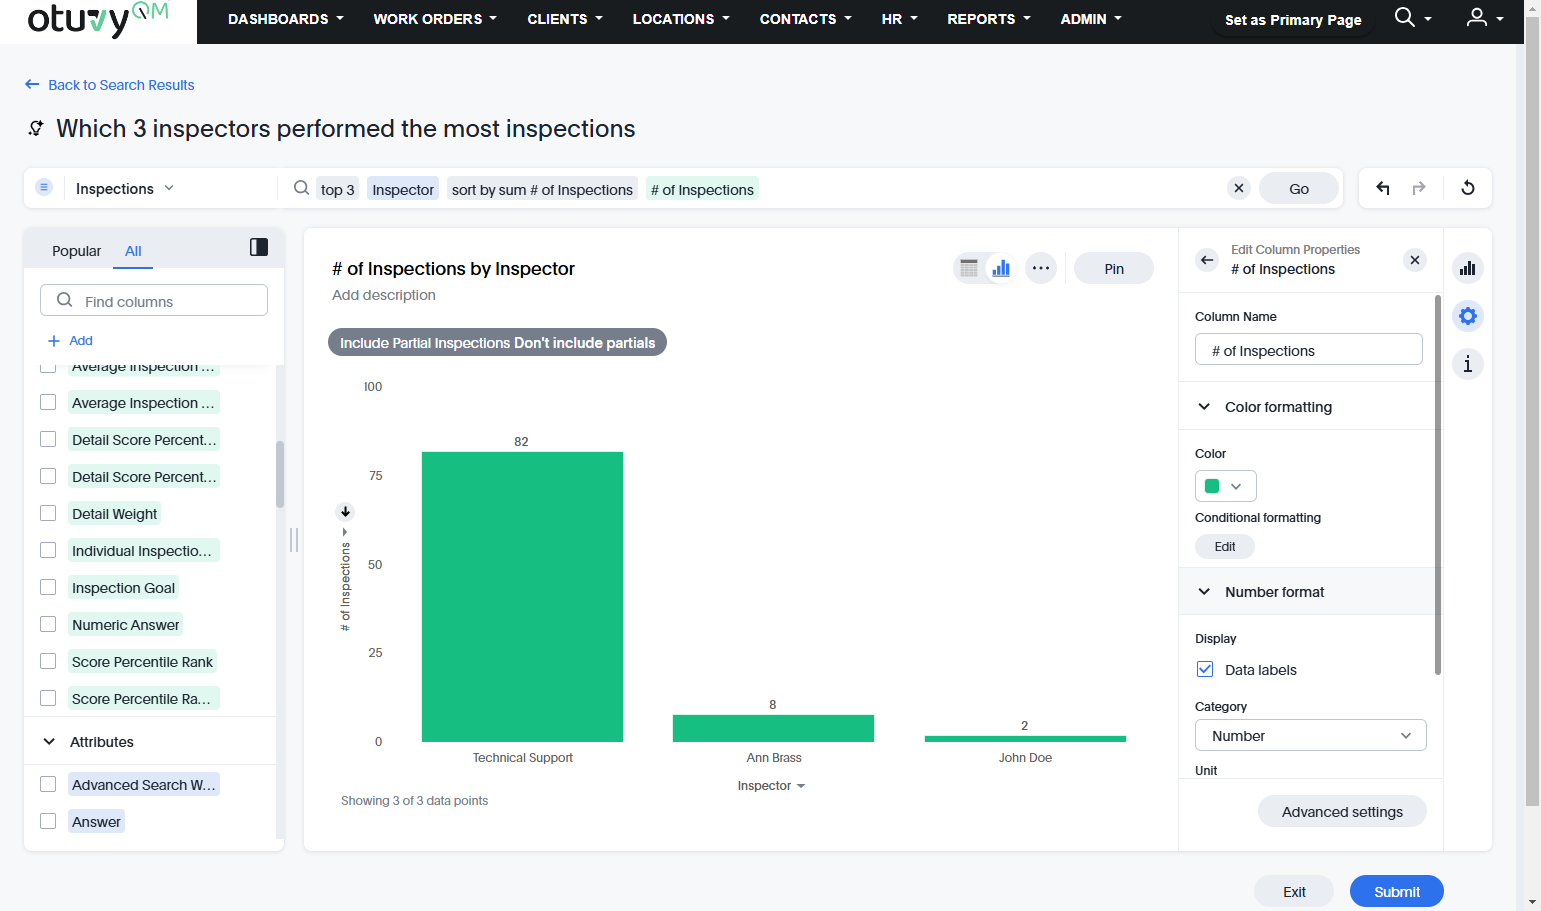
Click on the cog icon to edit the chart configuration. There's lots you can do here.
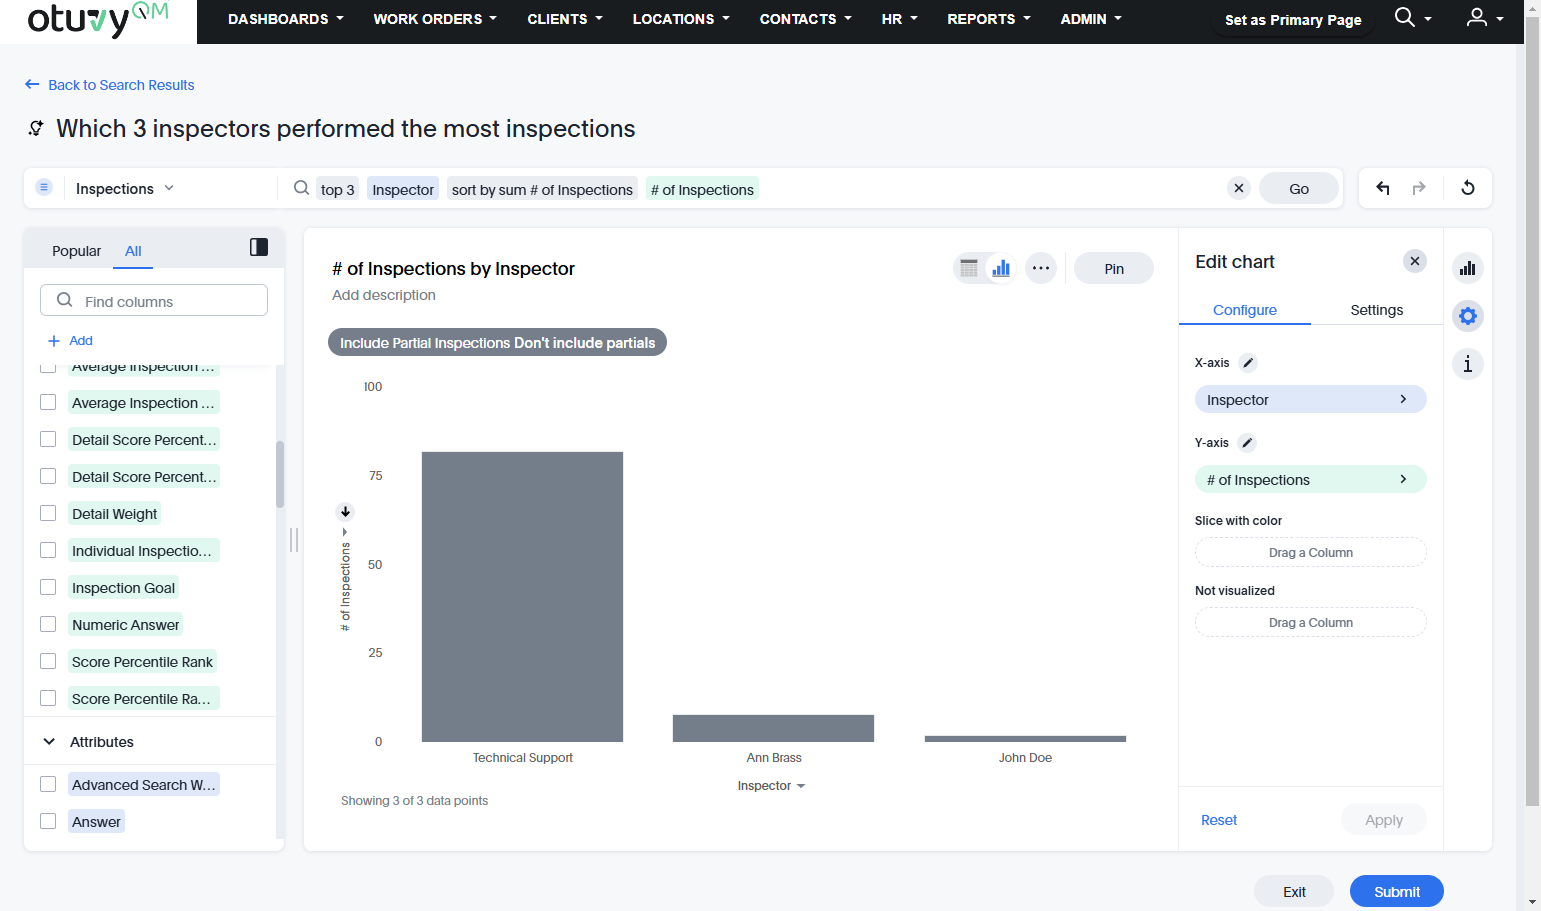
You can display data labels
You can set the color used in the visualization
and much more
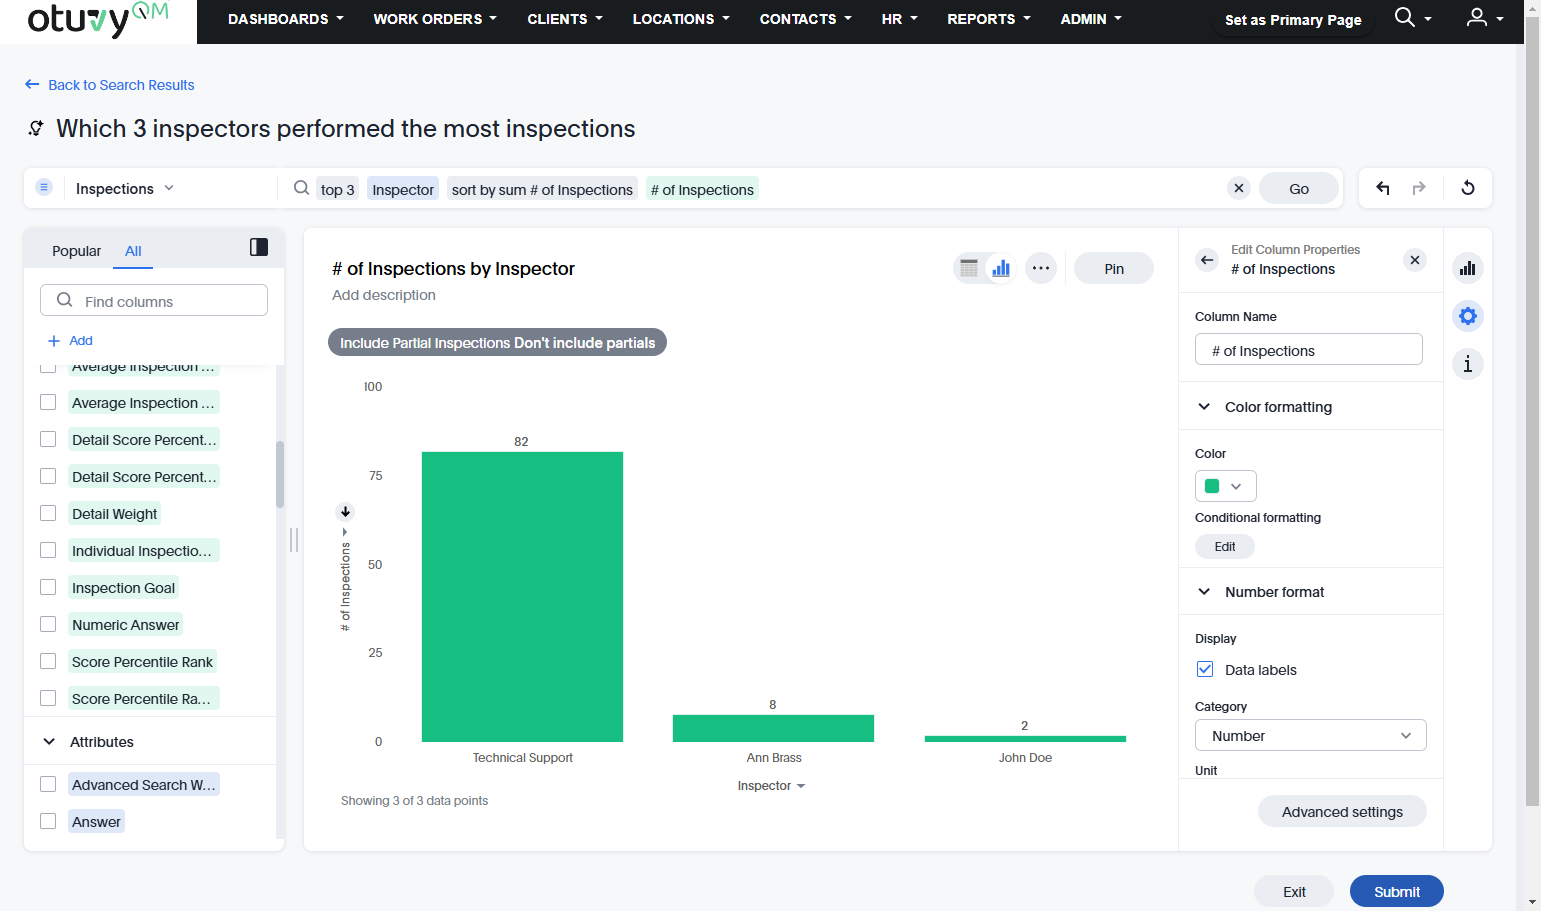
16. Submit Your Changes
To finish training the AI, click the Submit button at the bottom of the screen
17. Approve Mapping
Now that the data is mapped properly, approve the mapping for each item if it is correct to train the AI for future requests
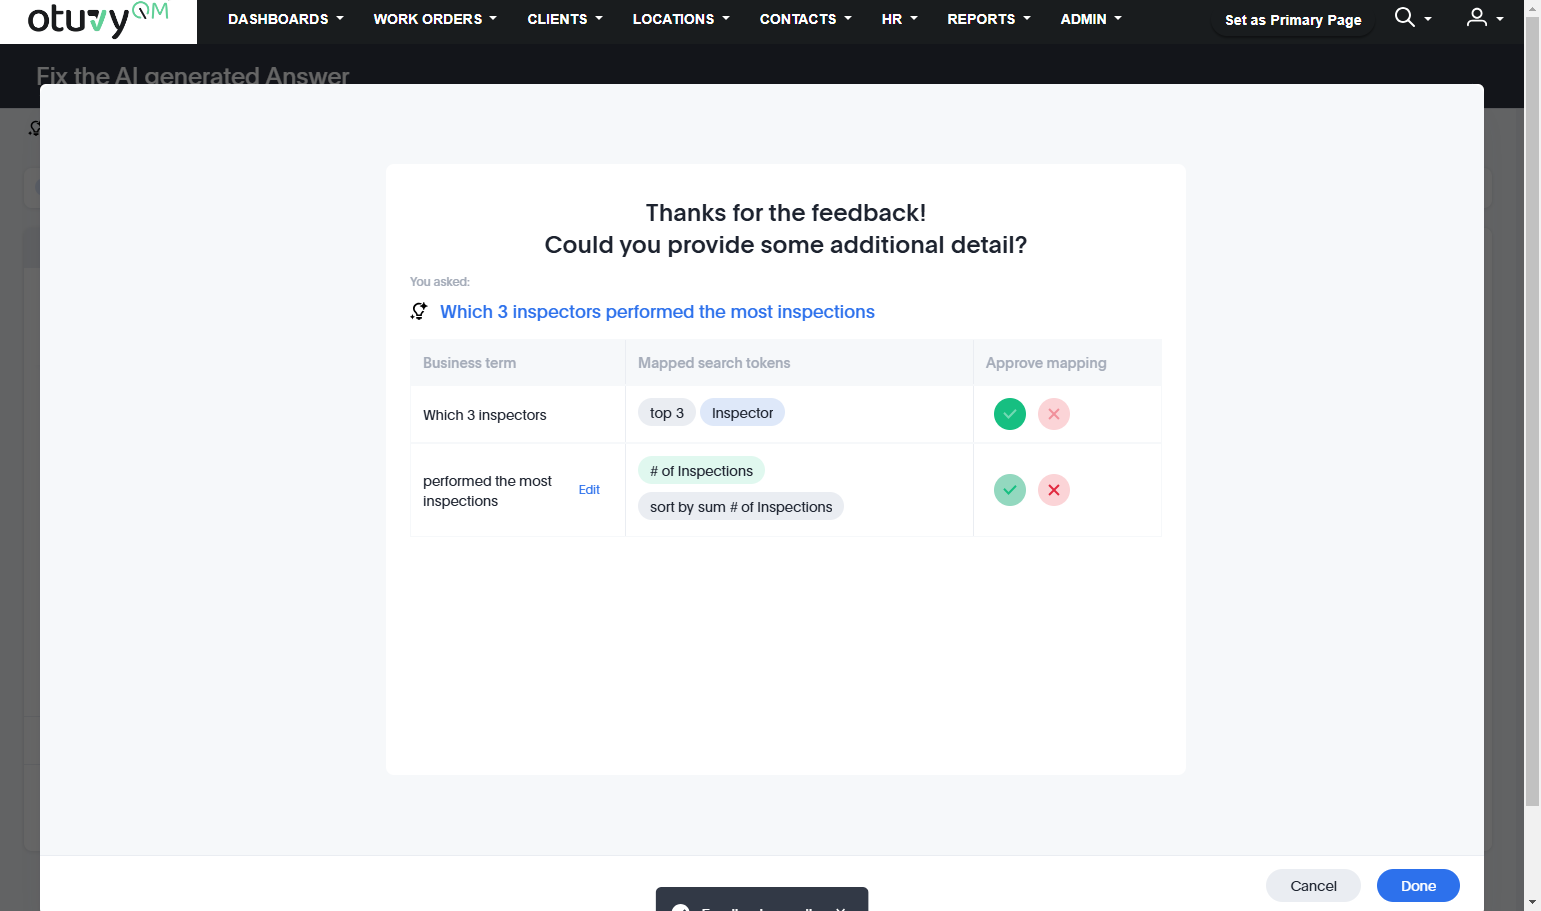
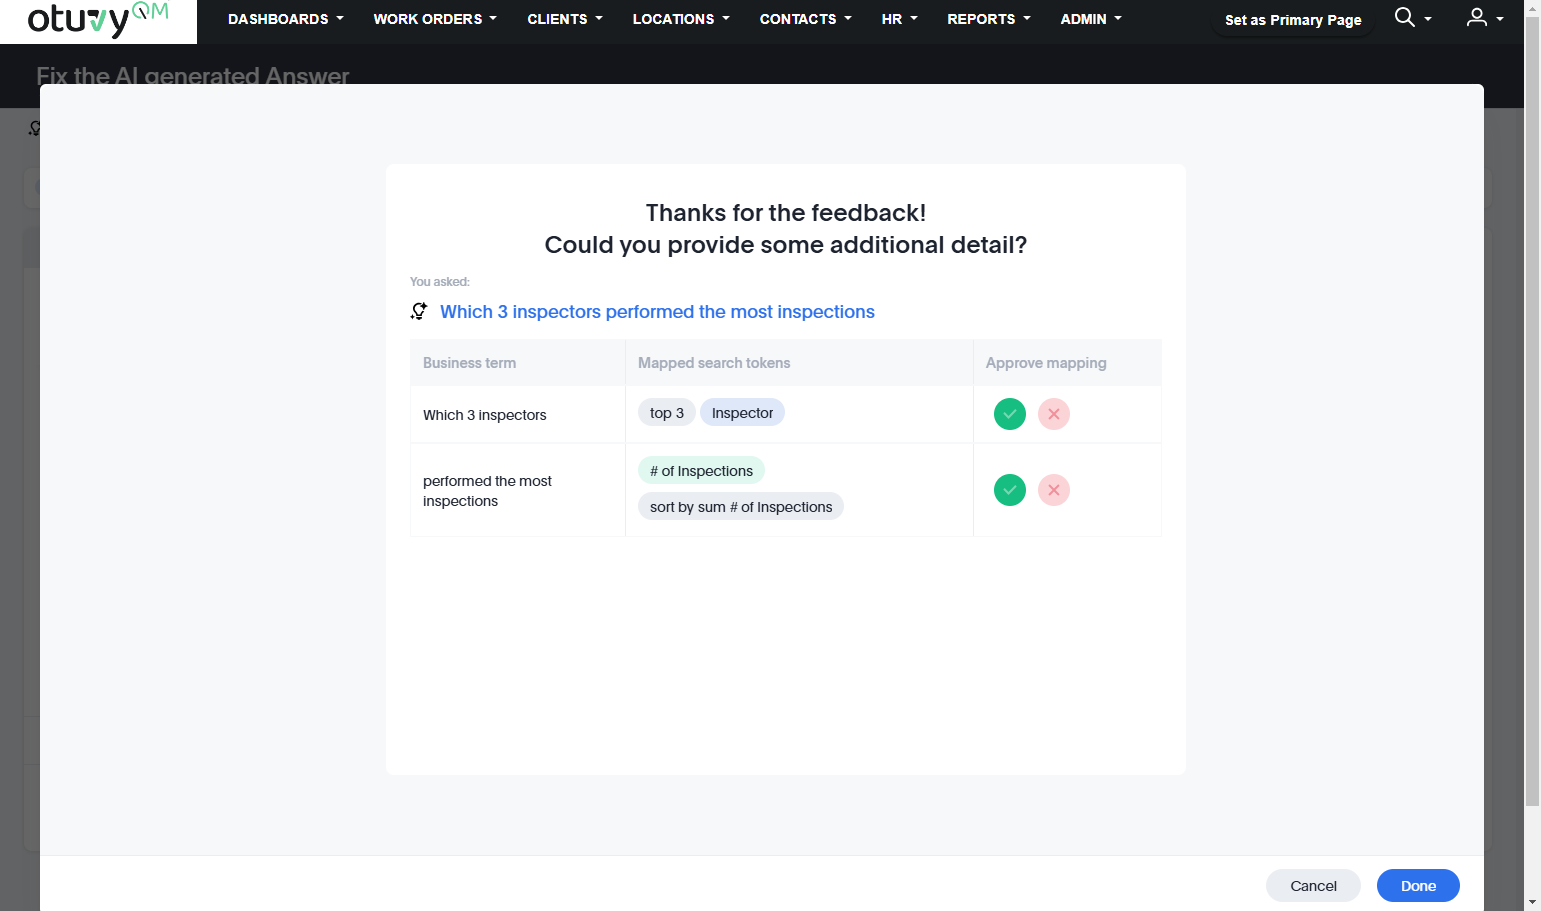
18. Click on Done
Once you've finalized the approval process, click on Done
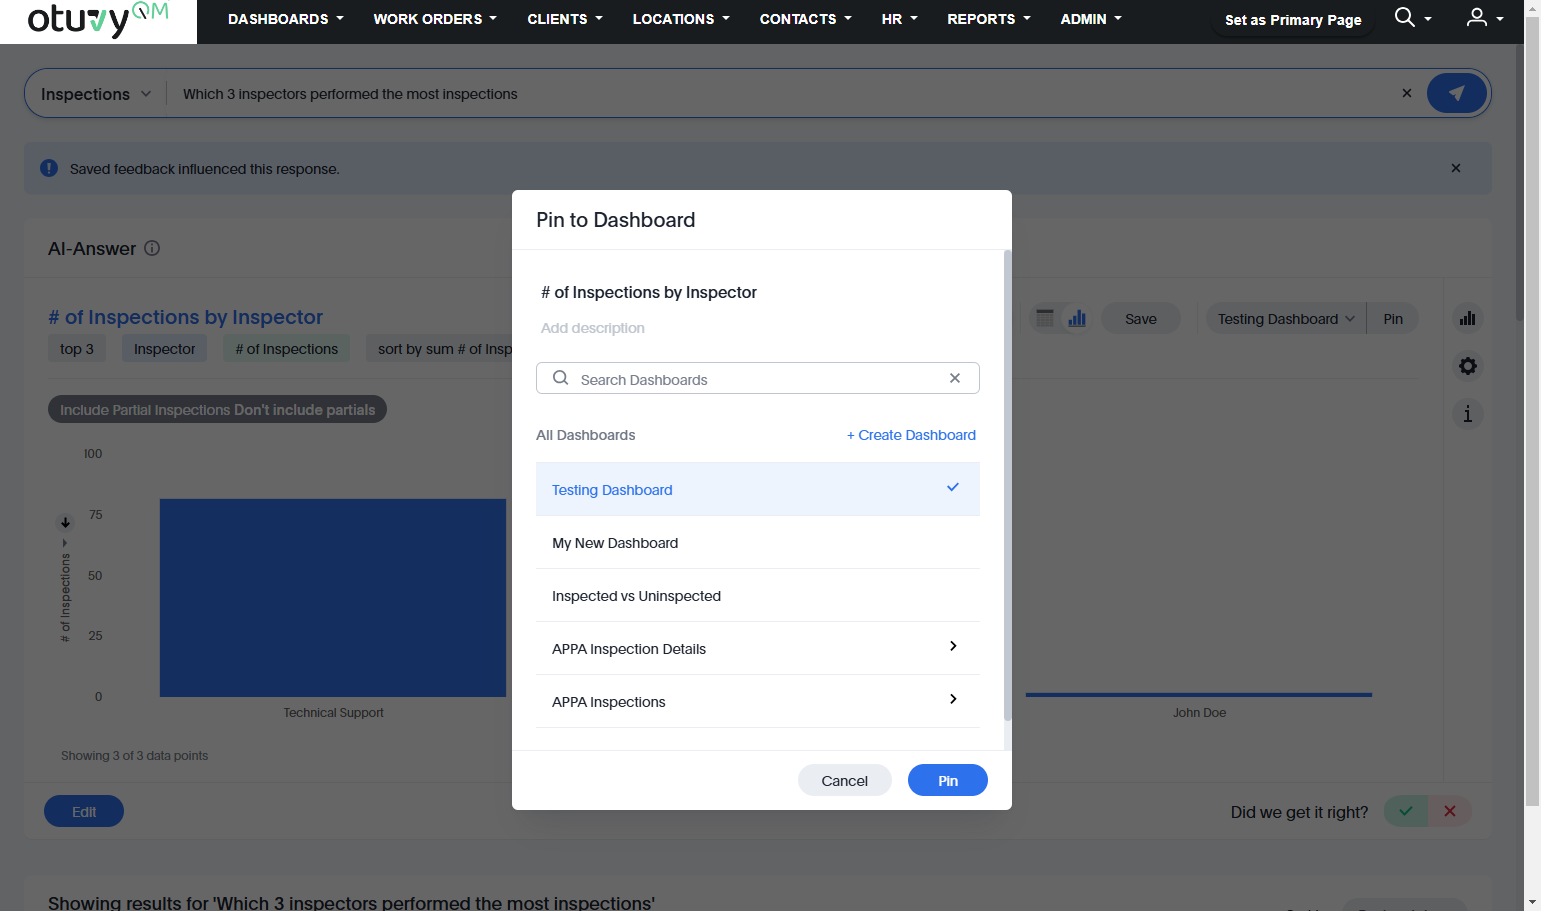
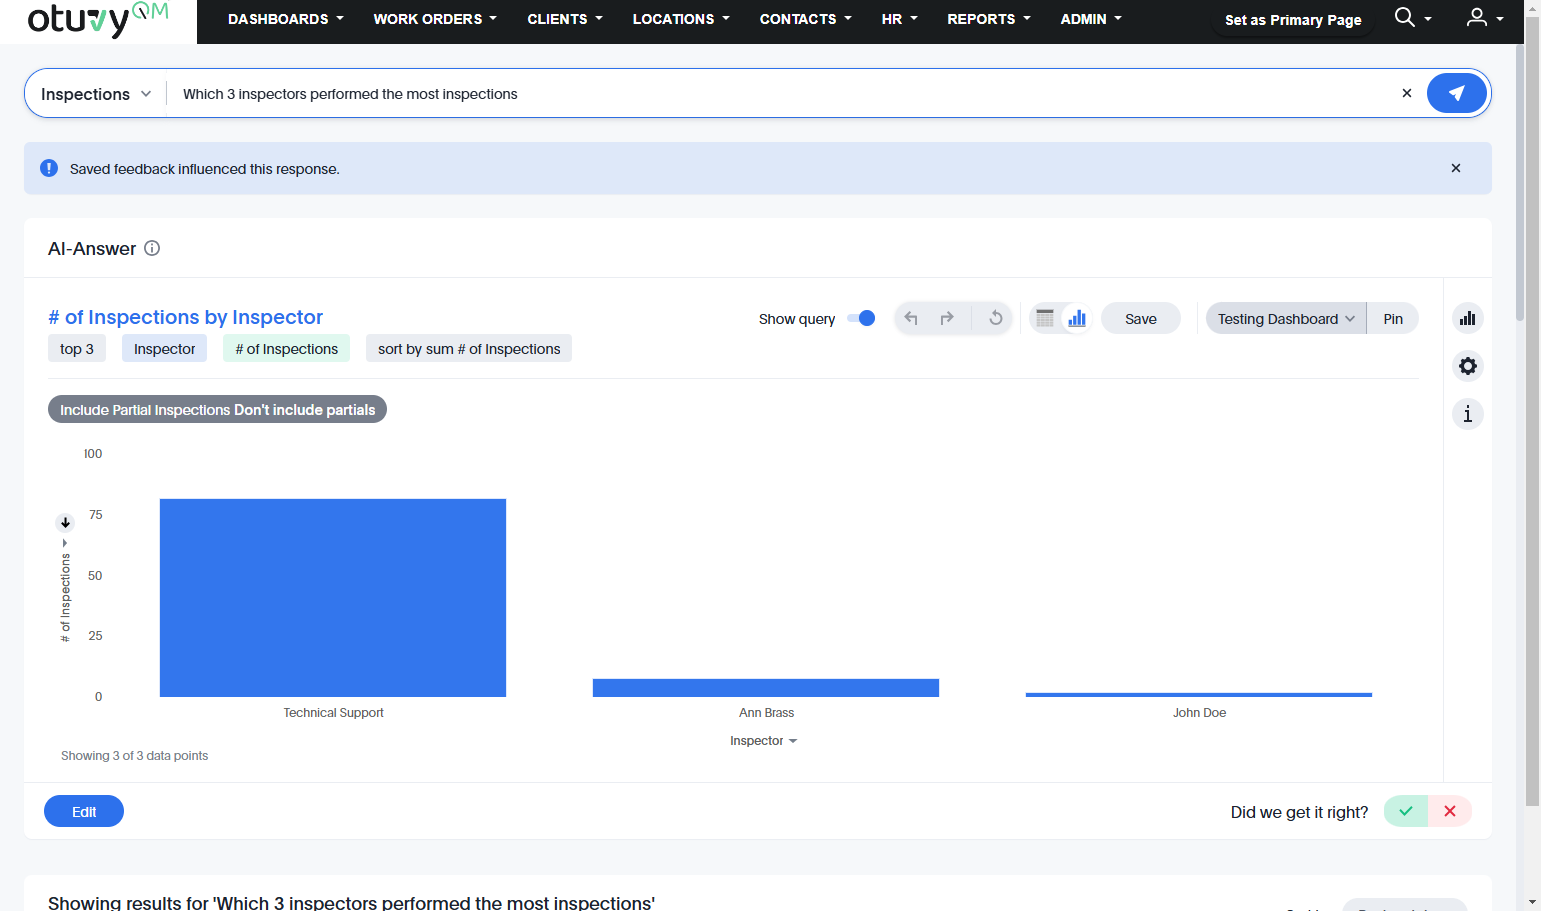
19. Click the Dashboard Selection dropdown
This allows you to pick the dashboard you want to pin this visualization to
20. Select the dashboard from this window
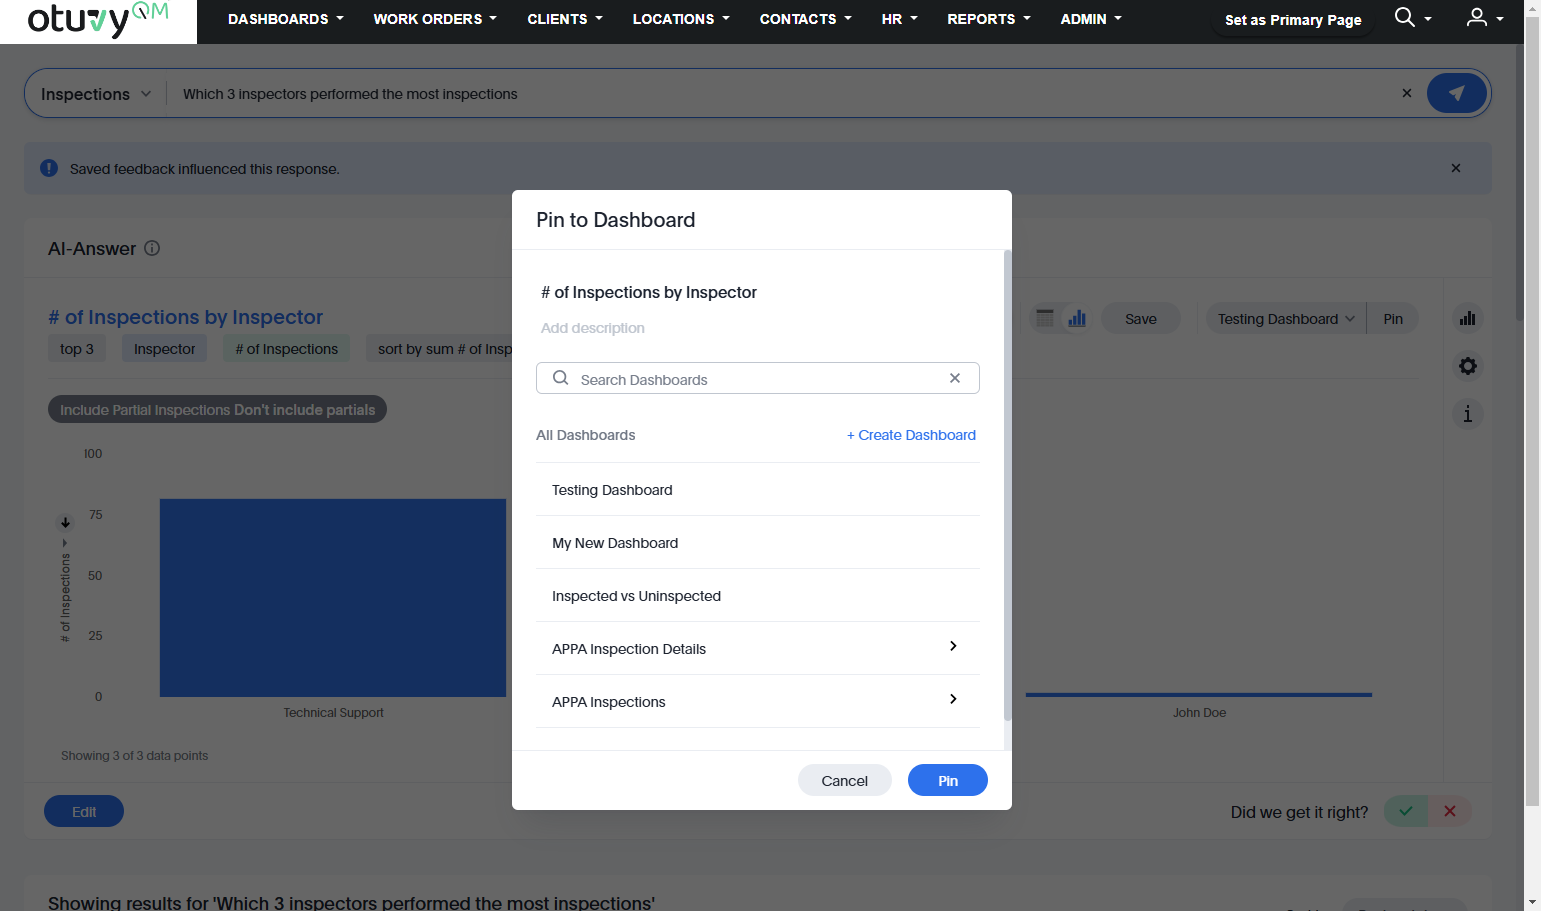
21. and then click on Pin